
Unlock Instant Process Insights: QPR ProcessAnalyzer Now on Snowflake Marketplace
We’re excited to announce that QPR ProcessAnalyzer is now available on the Snowflake Marketplace. As the only process mining software worldwide with native...

QPR ProcessAnalyzer 2019.9 introduces Interactive Filtering and Root Cause analysis directly from the header for super easy process mining analysis. New Interactive Header is the new control center from everyday process mining analysis to more advanced multi-level filtering and root cause analysis.
New QPR ProcessAnalyzer user interface with advanced multi-window analysis view is here! :)
This is what you can expect:

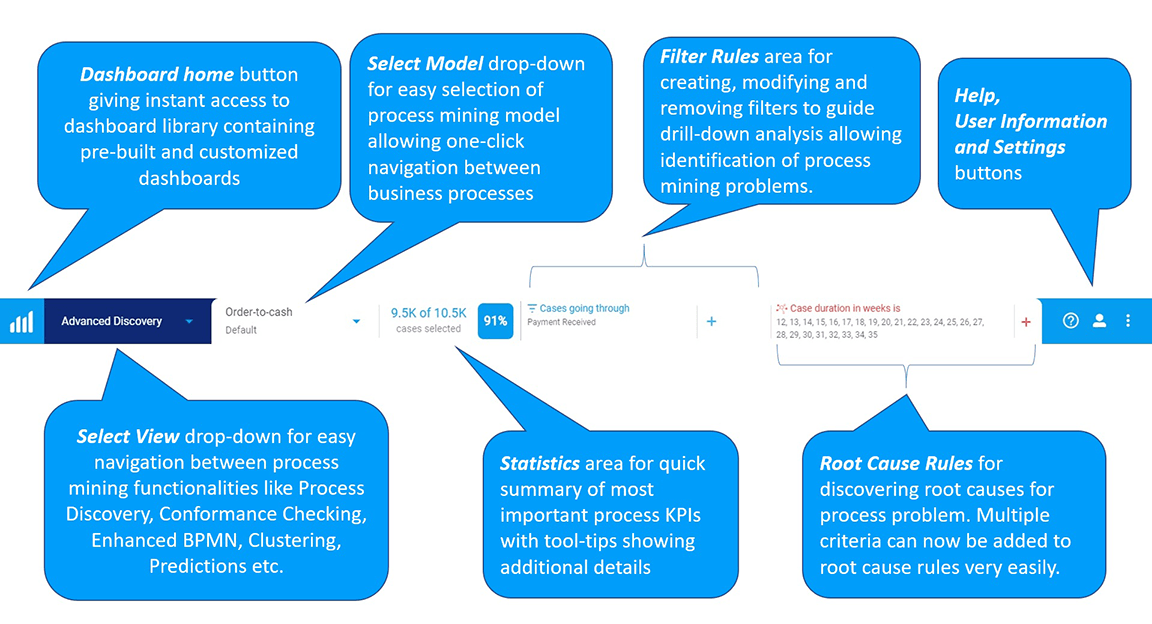
The Interactive Header shown in the above picture has these generic elements:
Screen captured picture below show the main components for the new Interactive Header. From left to right:
Interactive Header controls are shown in this picture:
With the new Interactive Header it is easy to:
Every large organization is following several Key Performance Indicators (KPIs) - typically using pre-built and ad-hoc reports in their BI reporting systems as well as manual Excel sheet analyses. However, the challenge with these existing reports is that they do not provide possibility for process based root cause analysis. If for example the delivery of goods to customer is sometimes taking a long time and the delivery is not done in time, then it would be great to learn the root causes for these problems so that the process can be improved. Case Attribute Root Cause Analysis analysis for KPIs is exactly this - and now supports free custom KPIs using the QPR ProcessAnalyzer expression language! This means that you can add root cause analysis drill-down to any existing KPI you have in your reporting application - user just clicks on the link in the reporting application and gets instant access to process mining root causes - voila!
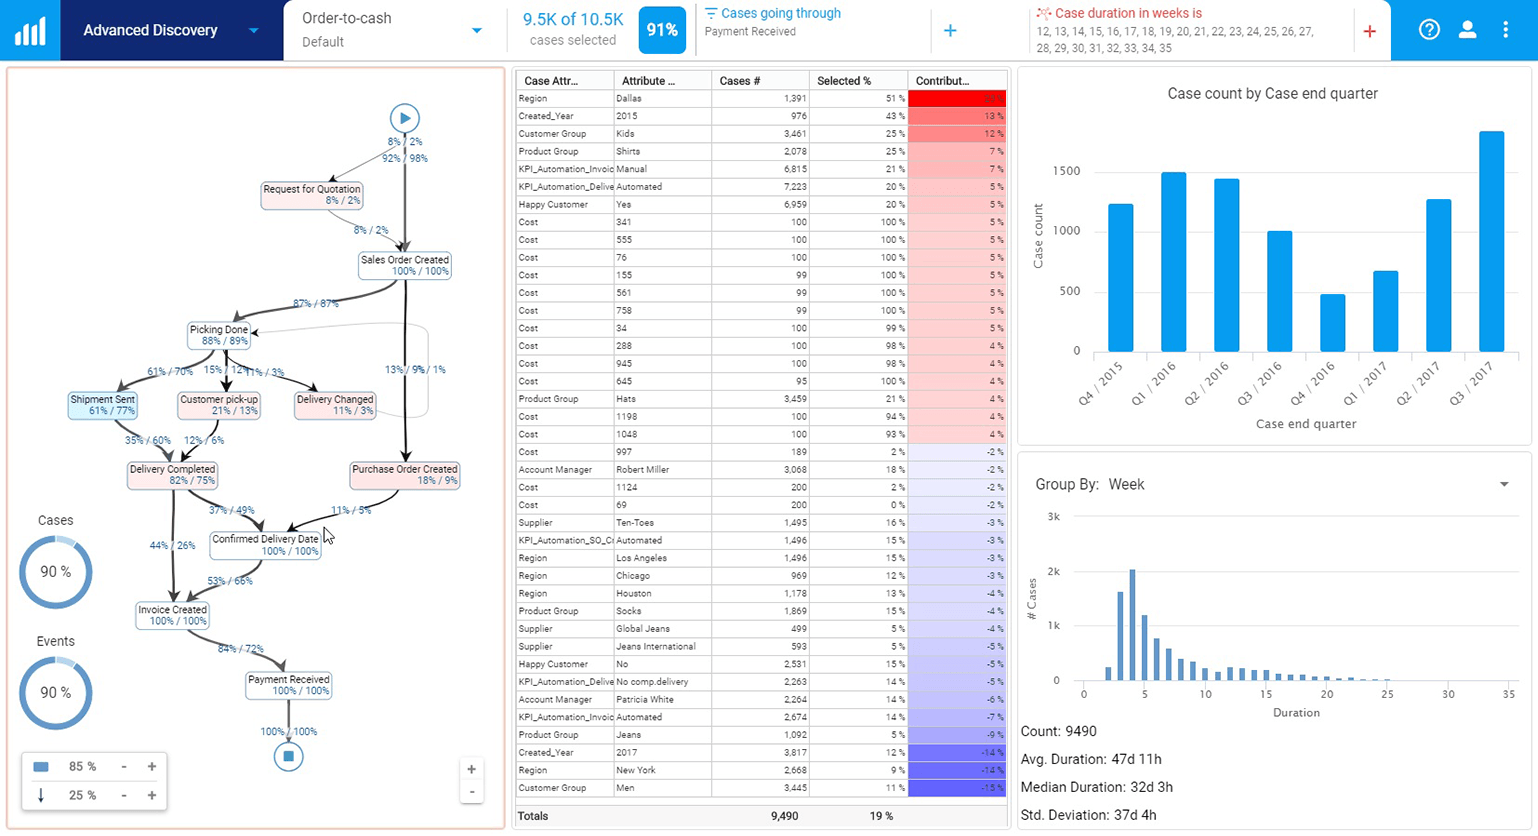
The picture below is both process flow and case attribute root cause analyses for the KPI "case duration in weeks in 12 weeks or more":

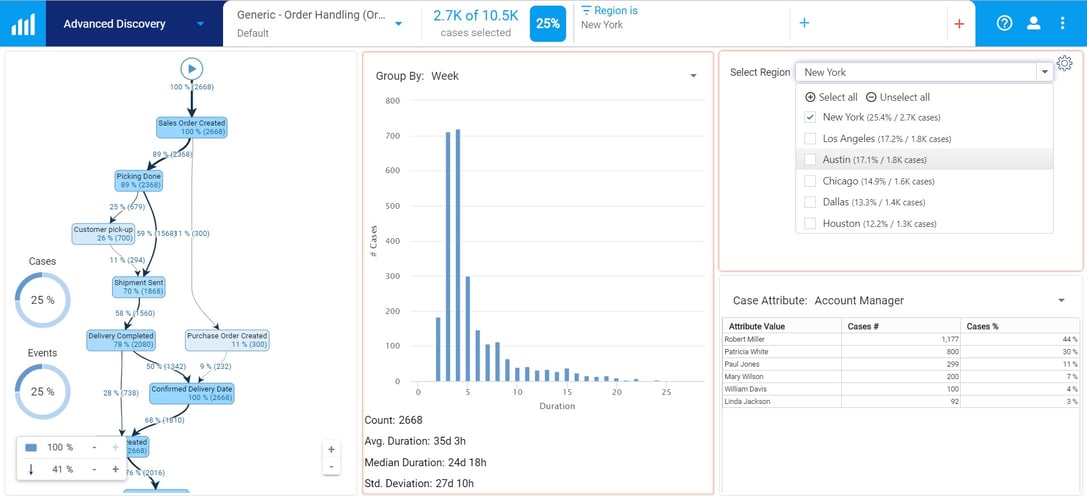
It is possible to create fully customized analysis and reporting application using the QPR ProcessAnalyzer Views. In 2019.9 we have added more easy-to-use logic for making the views including a new visualization called "Case Attribute Filter". Choosing this option let you t create easy-to-use drop-down selection controls showing possible values for any given case attribute with the amount and share of those values. The picture below shows this control in action: New York has been selected as the Region including 25.4% of the cases (~2 700 cases).
QPR ProcessAnalyzer 2019.9 is shipped with pre-configured process mining charts for typical process mining tasks including:
This is the new QPR ProcessAnalyzer 2019.9! I hope you are as excited as me! If you’re already using QPR ProcessAnalyzer, go ahead and try these new features out when you get a chance. If not, and if you’re new to Process Mining, read more on this page. If you want to know more about QPR ProcessAnalyzer, go here. Also, don’t hesitate to book a live QPR ProcessAnalyzer demo:
On Tuesday, 17.12.2019, 1:00-1:30 PM EET, we will hold a Release Webinar to introduce and explain more about these updates. Register here!
It’s a good time to take a look at Process Mining if your company hasn’t already. Capabilities and usability of Process Mining software are improving rapidly and the market is quickly becoming mature, though there’s still much work to be done. If you think your company is ready to step it up with the future of as-is process modeling and process efficiency maximization, the fastest way to get things moving is to send our Process Mining team a direct message:


Share Online

We’re excited to announce that QPR ProcessAnalyzer is now available on the Snowflake Marketplace. As the only process mining software worldwide with native...

QPR Software's decision to power its process mining solution with the Snowflake Data Cloud has recently received a warm welcome in the US market. This...

In today’s data-driven world, businesses are constantly seeking innovative ways to optimize their operations. Process mining stands out as a transformative...
What would you do if you had a digital replica of your business operations? Imagine being able to peer into every corner of your organization, analyze...
Featured Blog
Identifying inefficiencies, risks, and automation opportunities with process mining
“With QPR ProcessAnalyzer, we were able to analyze the process in 2-3 hours instead of three weeks“
Read more