



Your strategy is approved. Can you see it working?
QPR Metrics turns strategy into objectives, KPIs and initiatives that every level of your organization can own — and shows leadership, every period, what is on track, what is slipping and which improvements are paying off.
Customer rating: 9.7/10
Organizations use QPR Metrics to run strategy, targets and reporting in one place.
Strategies rarely fail in the plan. They fail in the months after it.
When nobody can see clearly what is moving, execution turns into status meetings, spreadsheet versions and guesswork.
KPIs live in spreadsheets and slides
Every unit reports in its own way, and meetings go to debating whose number is right.
Reporting eats the calendar
Collecting, checking and formatting results takes weeks. By the time the report is ready, it describes the past.
Initiatives drift from targets
Projects get funded and run, but nobody can show which objective each one is meant to move.
Improvements go unmeasured
Processes are redesigned and automated, yet the effect on business results remains an estimate.
One place where strategy, targets and results meet
QPR Metrics brings strategy, targets and performance into one shared view. Connect strategic objectives with KPIs, initiatives and risks, cascade targets across the organization, and follow progress with up-to-date dashboards and reports.
- Model. Turn your strategy into linked objectives, KPIs, initiatives and risks using Balanced Scorecard, XPP or your own management model.
- Cascade. Translate company-level targets into clear goals for divisions, teams and individuals.
- Collect. Bring performance data automatically from your source systems — or manage it manually with controlled approval workflows.
- Act. Spot deviations early, follow initiatives and turn performance data into management and board-ready reporting.
The right view for every level of the organization
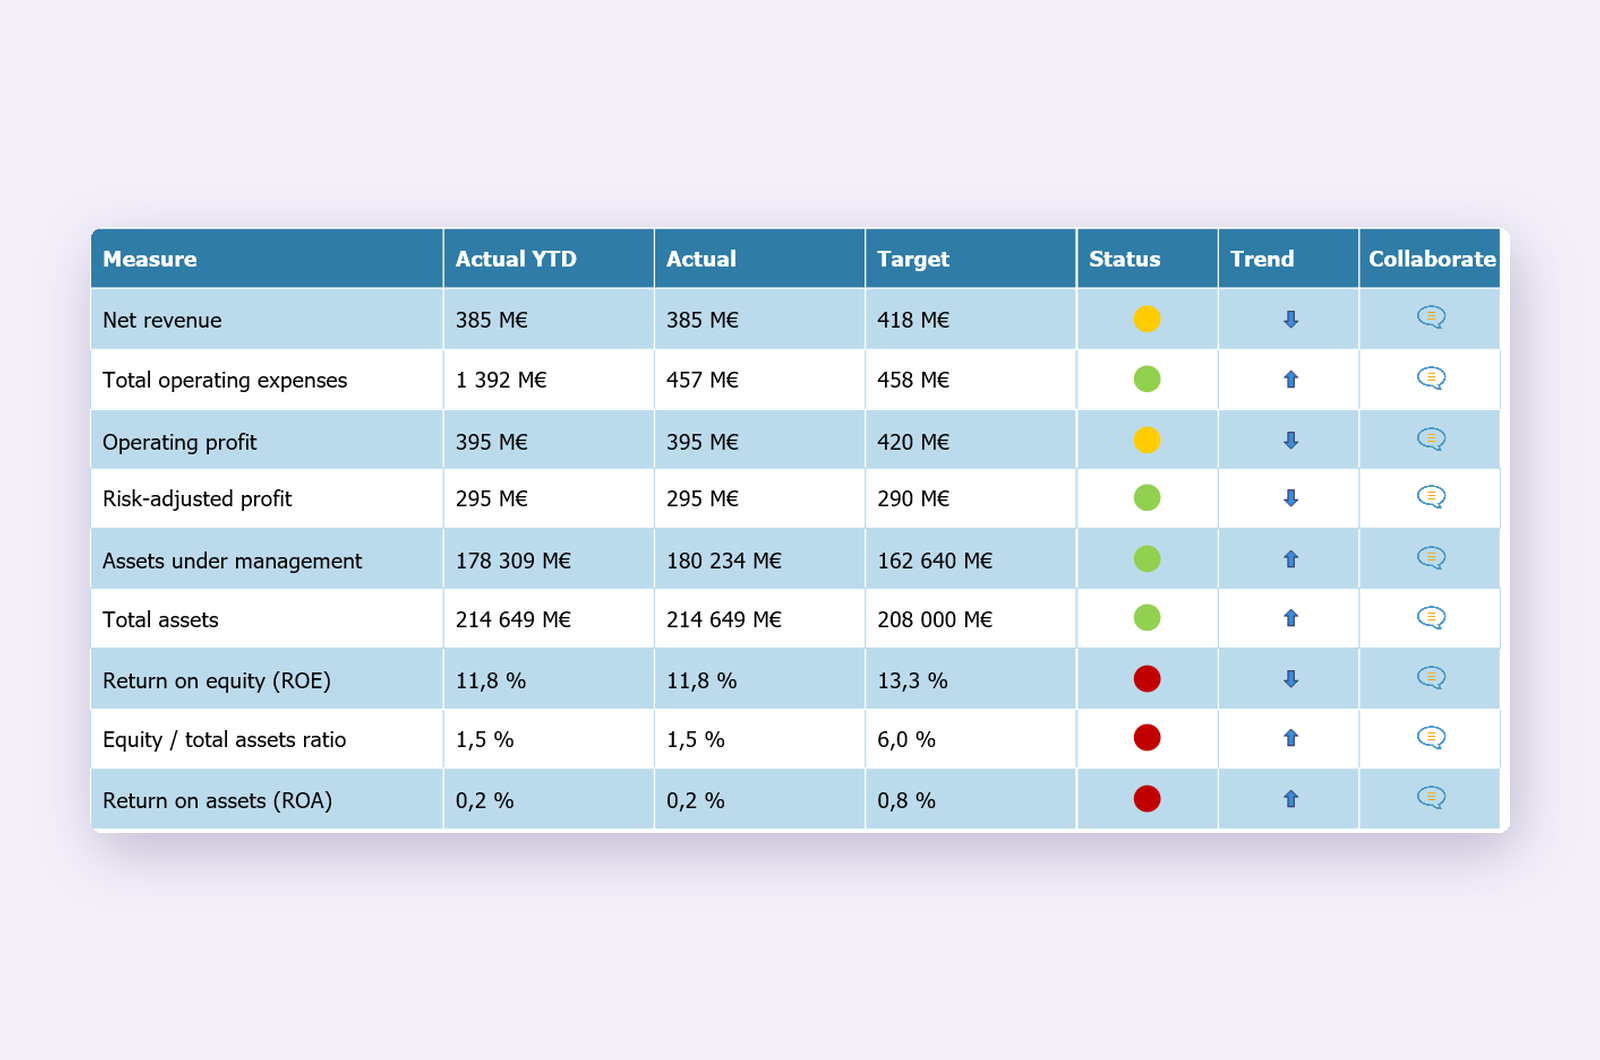
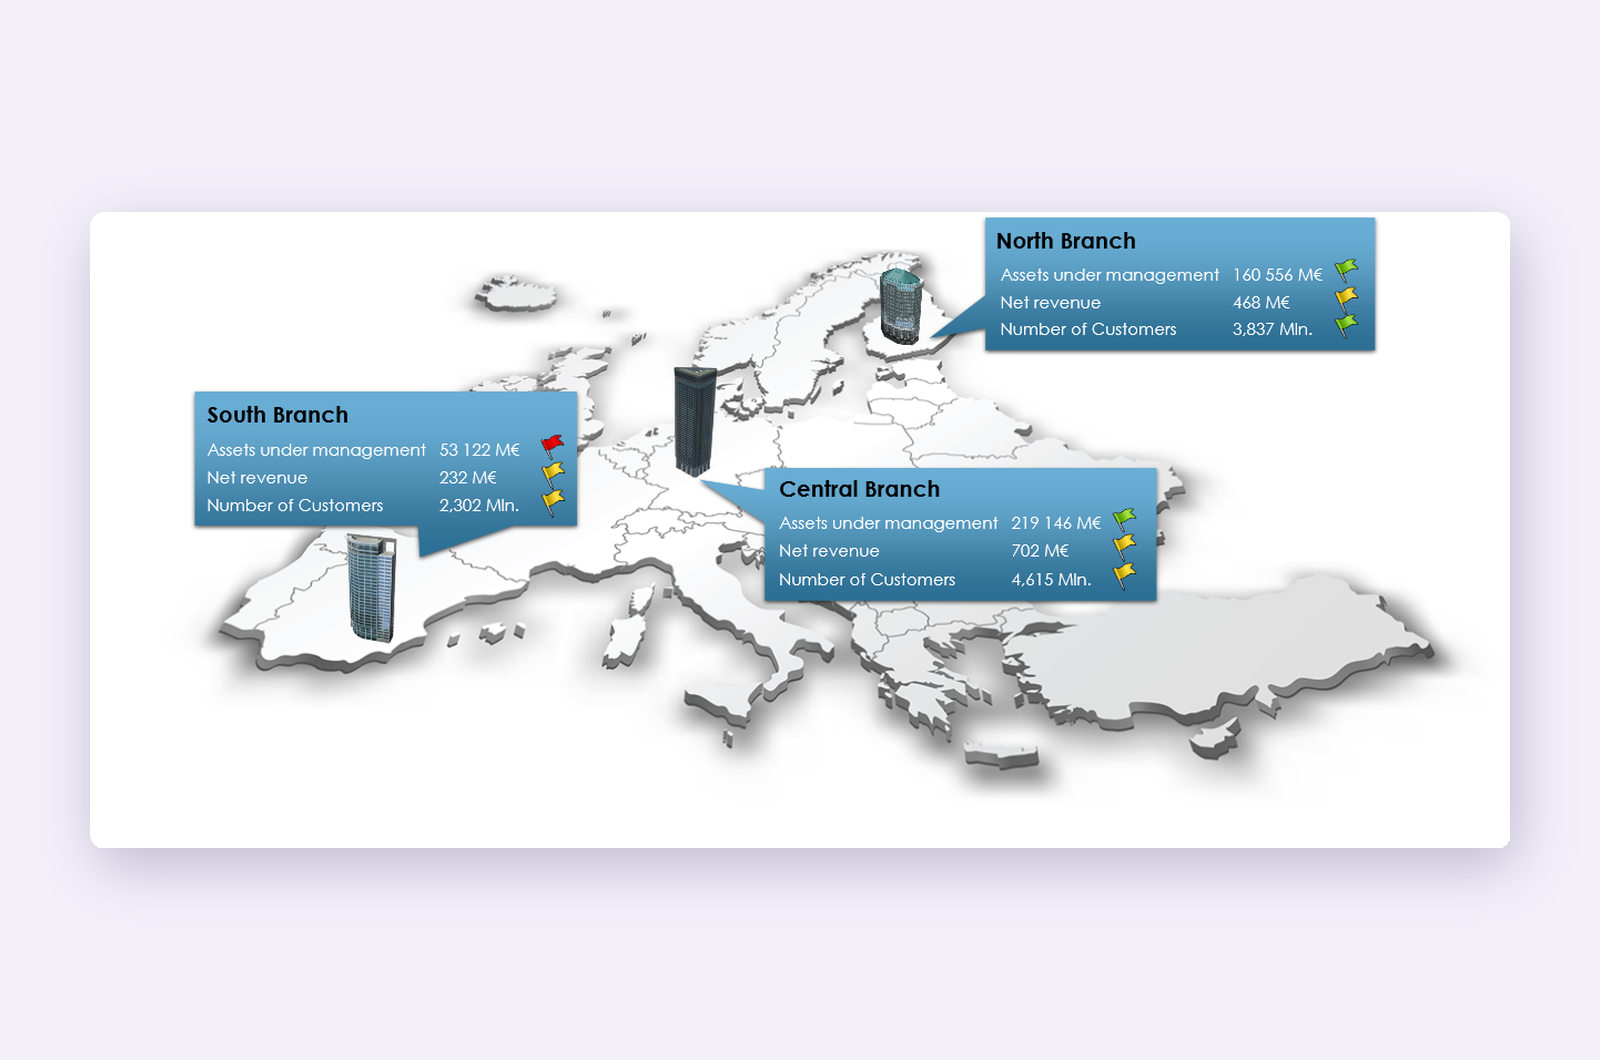
Targets cascade from group level to divisions, departments and individuals. Each manager sees the measures they own, with status, trends and comments in one place — while results roll up automatically for leadership.
Build views around the way your organization works: by business unit, region or strategic perspective. Leadership gets the full picture, while every team sees what it can influence.
Part of QPR Process Intelligence
Process improvement only counts when results improve. QPR Metrics closes the loop: it shows whether the changes you design, connect and analyze with QPR's other products actually move the numbers that matter.
QPR ProcessDesigner
Defines how work should happen, with process models people and AI can use.
QPR EnterpriseArchitect
Connects processes to systems, capabilities, data and strategy. New in 2026: QPR Metrics links appear directly in its hierarchy views.
QPR ProcessAnalyzer
See which improvements actually pay off
We'll show you how QPR Metrics turns your strategy into KPIs every team owns, and how it connects them to what QPR Process Intelligence reveals about your processes.
Key capabilities of QPR Metrics
Align strategy with execution by tracking objectives, KPIs, initiatives, and projects in one place. QPR Metrics supports enterprise-wide performance management as well as PMO use cases.
A renewed web user experience makes it easier for end users to navigate, monitor performance, and act on insights.
Built-in workflows support smoother governance and execution, ensuring updates are reviewed and actions are followed up.
Track strategic initiatives and improvement actions with greater transparency, monitoring progress and ownership.
Bring together data from multiple sources to support consistent performance management and reporting.
Use QPR Metrics with relevant management and performance frameworks, including scorecard-driven approaches.
A strong calculation engine supports complex performance logic, while reporting capabilities turn data into actionable insight.
Configure the solution without heavy custom development and scale it across business units and functions.
Emerging AI capabilities include intelligent recommendations and AI-assisted interaction through natural language.
See how leading companies drive change
Wärtsilä transformed their internal audit approach with QPR ProcessAnalyzer
"We get total visibility to our processes and data, there’s no longer a need for extrapolation and assumptions based on sampling."
Metsä Group eliminates uncertainties through continuous improvement
"The process insight and facts delivered by QPR ProcessAnalyzer were priceless. We were immediately able to focus our process improvement activities on the right things to achieve the results our business needed. Not wasting time on trial and error.”
Piraeus Bank cuts lead times by 86% through unprecedented process transparency
Piraeus Bank locates process bottlenecks and increases efficiency.
"We gave the data to QPR ProcessAnalyzer, and right away, in 5 minutes, we saw the bottlenecks of the process."
Sanofi streamlined their internal job change process with QPR ProcessAnalyzer
“By combining user-centric process design with QPR ProcessAnalyzer, we reduced the median Job Change Process duration from 8.9 to 0.9 days and cut completion times by 90%.”
Explore ideas for smarter business execution

Where Process Intelligence Is Heading: 5 Questions with Gary Chitan of TOCH Consulting