Why It’s Time to Rethink Sales with AI and Process Mining
Most sales leaders know their CRM holds a goldmine of data—but turning that data into real business impact is another story. This is where process mining comes...

QPR ProcessAnalyzer 2020.8 enhances your process mining experience with many cool features such as Process Queue Analysis to find Bottlenecks, Web Links for starting Business Actions, Flowchart Reset for quick zooming, Duration and Weighted Root Cause Analyses, User Management Web UI.
See the release webinar recording and download the presentation slides here.
How to find bottleneck flows in the process at any given time?
How to analyze one flow to find the peak bottleneck periods over a long time?
QPR ProcessAnalyzer 2020.8 contains enhanced support for analyzing business process queues and bottlenecks.
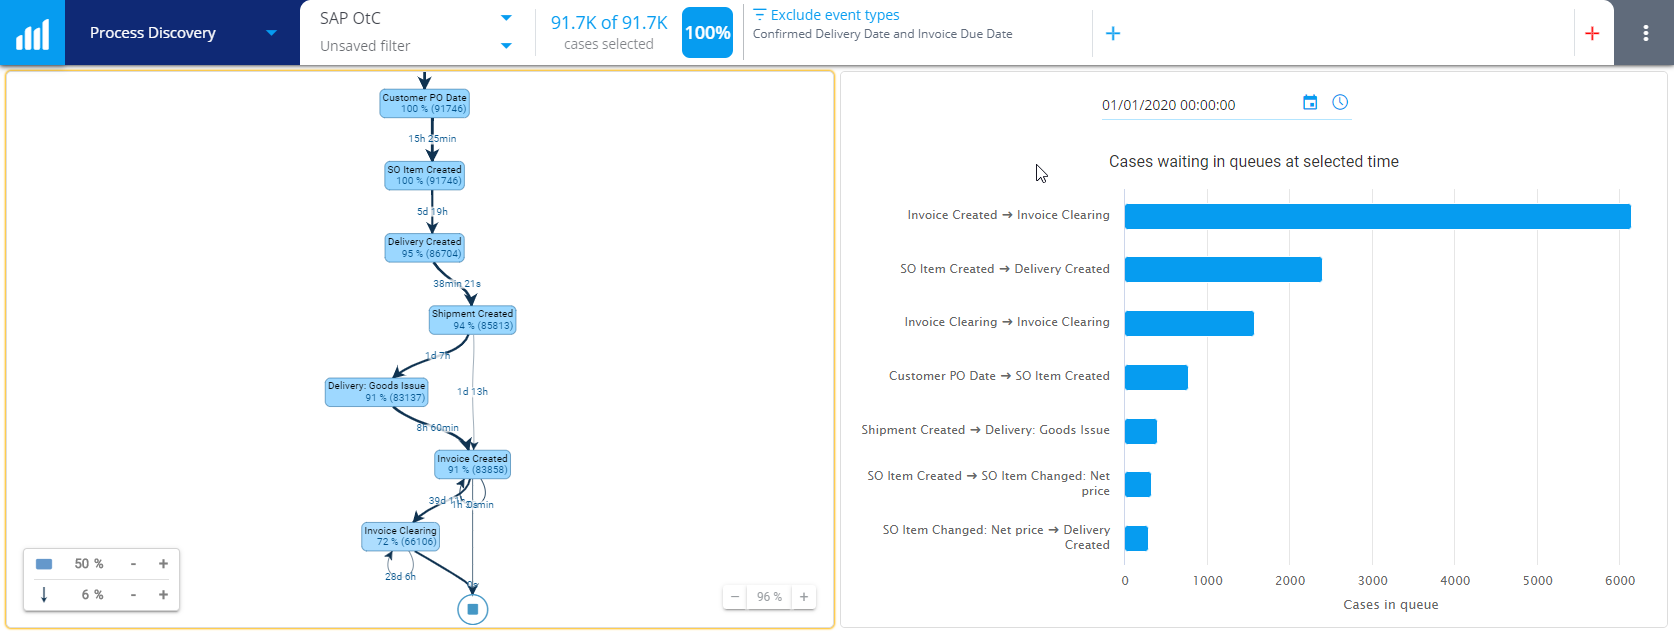
The new Queue Status by Flows preset Chart is an easy way to start analyzing queues and bottlenecks in detail. Using the chart just select the actual real-time moment you are interested in and the chart shows all Flows ordered by the queue length. This immediately gives a good understanding of some potential bottlenecks in that particular time. The picture below shows how the flow from Invoice Created to Invoice Clearing is a strong bottleneck candidate with more than 6000 cases in the queue on Jan 1st, 2020.
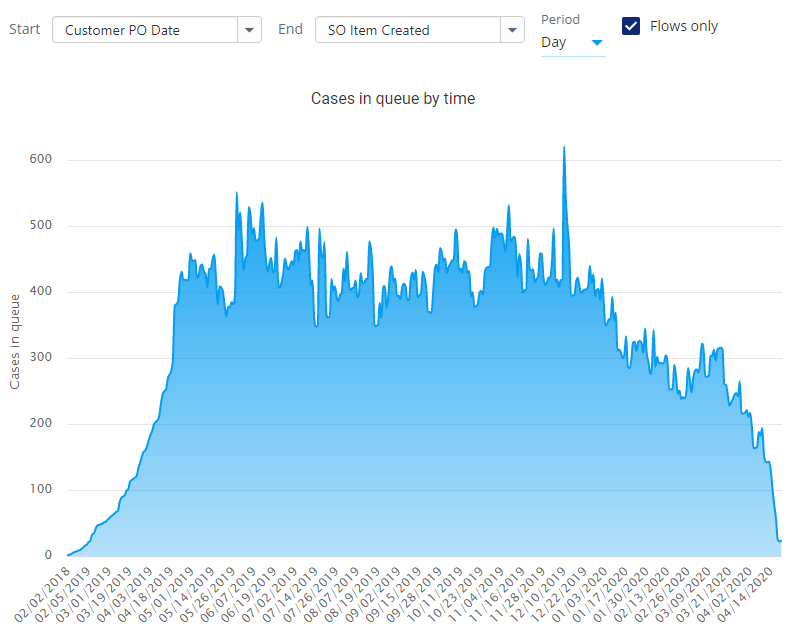
The peak performance period can be found using the Queue Analysis objects. A ready-made view is available as a Chart preset Cases in selected Queue Trend. In the picture below the daily trend is used to discover the peak period in early December 2019 with a daily queue length exceeding 600 cases.

How to ensure products are delivered on time?
How to improve data quality by updating information in ERP and Master Data Management systems?
How to view additional information in ERP systems?
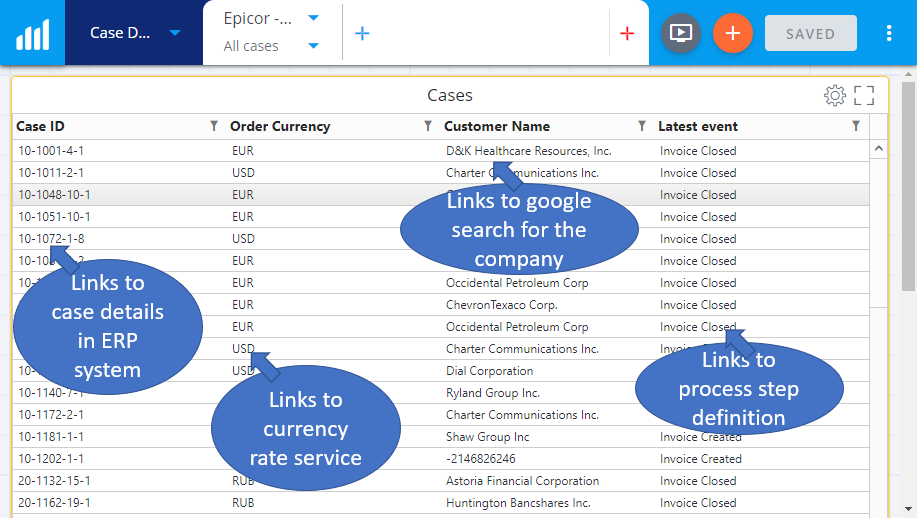
QPR ProcessAnalyzer 2020.8 Charts link directly to your ERP systems and other web-based tools for providing more information about the cases and starting follow-up actions.
More info about Web Links: https://devnet.onqpr.com/pawiki/index.php/QPR_ProcessAnalyzer_Chart#Measure.2C_Dimension_and_Column_Settings
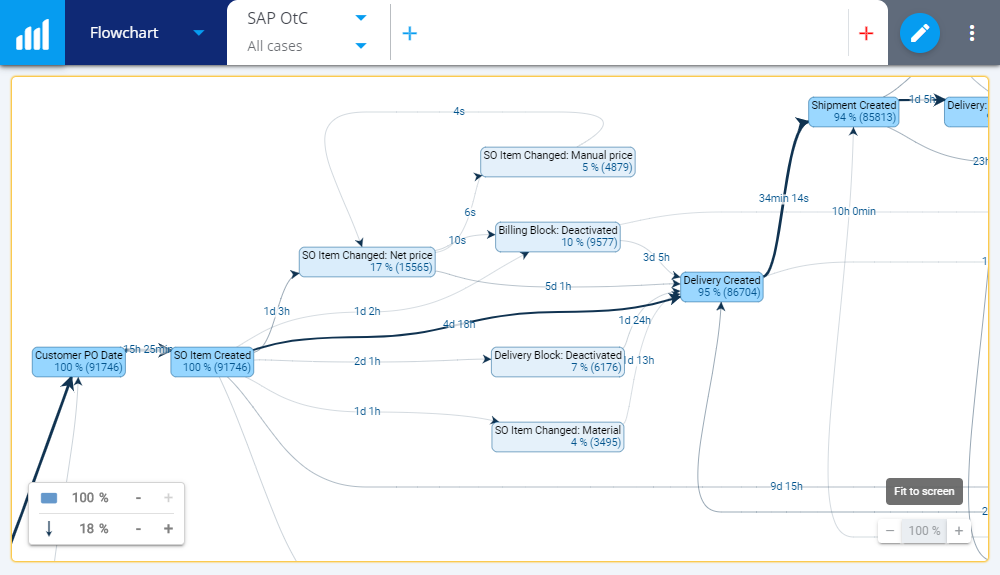
How to make the full flowchart visible?
How to make the flowchart easy to read by zooming to 100%?
Sometimes small usability improvements are really nice. The 2020.8 flowcharts reset and zoom functionality is an easy-to-use one-click feature for making the flowchart fully visible and resetting the zoom level to 100% for readability. The pictures below show the flowchart after the Fit to screen operation:
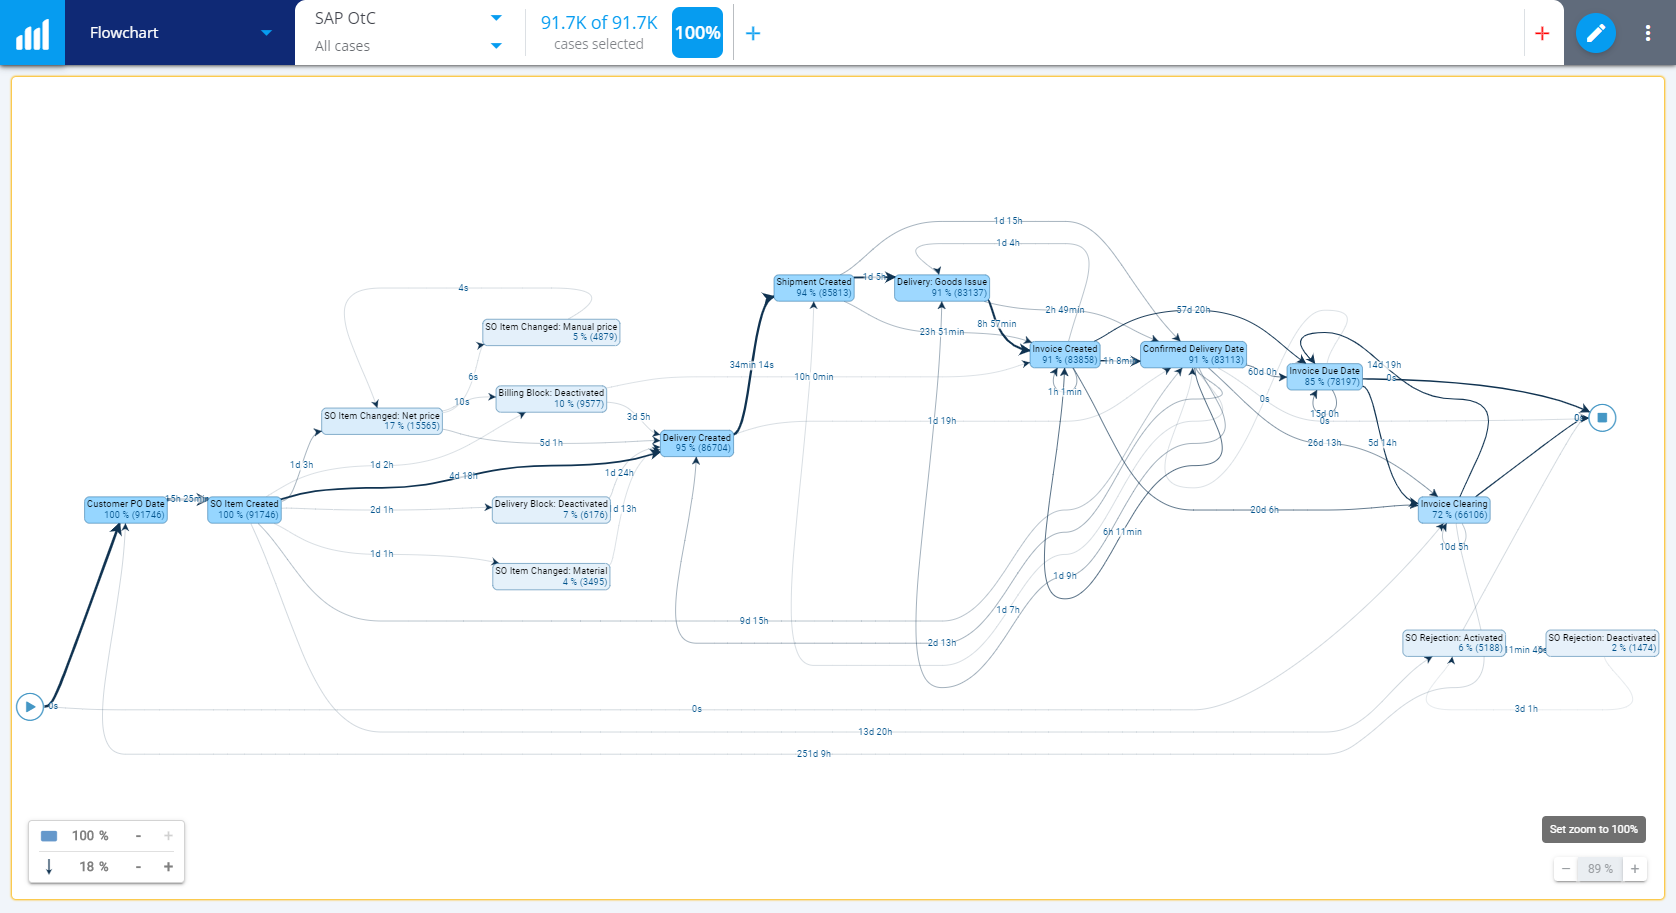
And below is the same flowchart with Set Zoom to 100%:
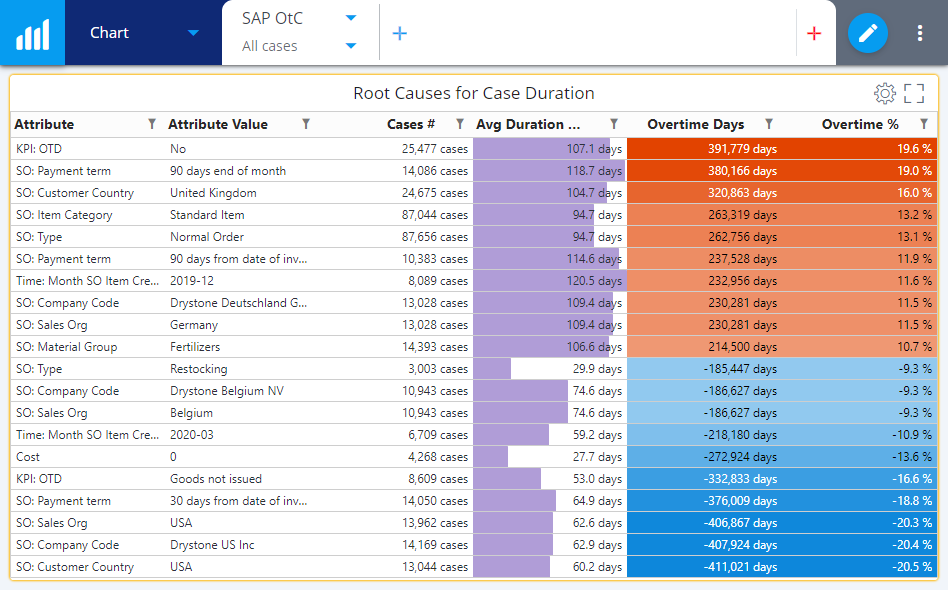
How to quickly find root causes for long case duration?
How to take the value of each case into account when analyzing root causes?
Long case duration is one of the most common process problems. The new preset Chart Root Causes for Case Duration is an easy-to-use one-click chart that shows the reasons behind long case duration as shown in the picture below:
Another new preset Chart for the powerful Root Cause analysis engine in QPR ProcessAnalyzer is the Root Causes for Attributes (weighted) preset Chart that shows the root causes weighted by a Cost attribute in each case. The picture below shows the root causes for manual price changes weighted by the case cost:
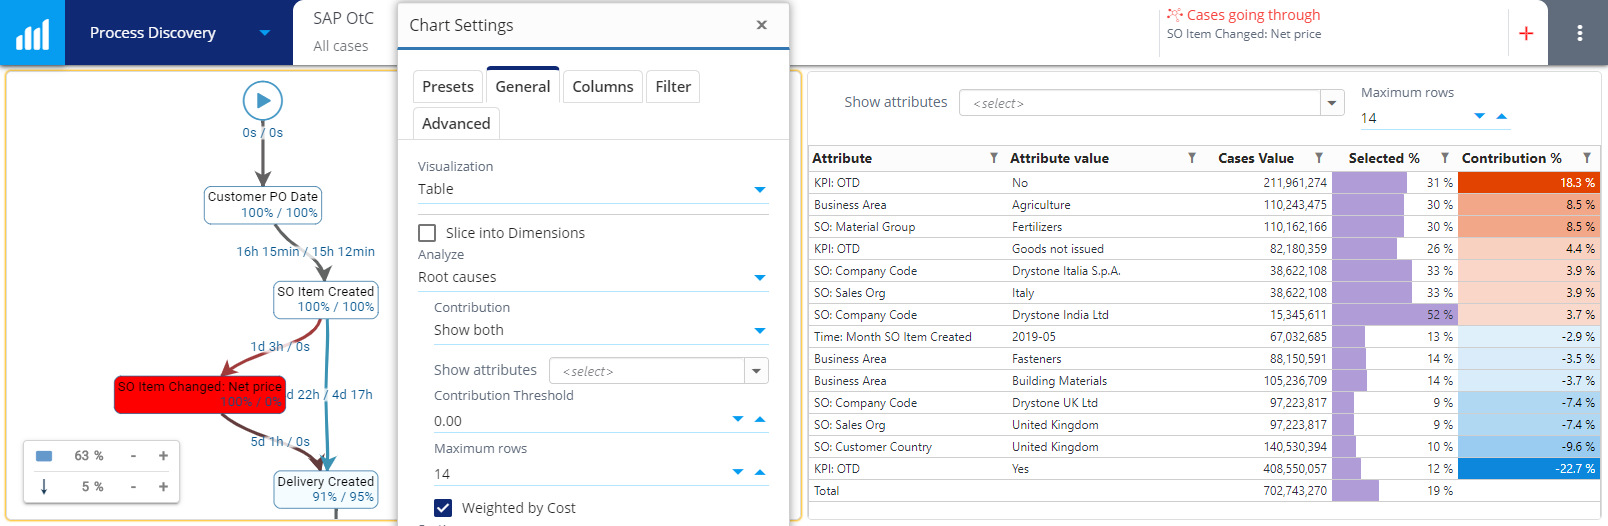
https://devnet.onqpr.com/pawiki/index.php/Root_Causes
More info: https://devnet.onqpr.com/pawiki/index.php/QPR_ProcessAnalyzer_KPI_Card
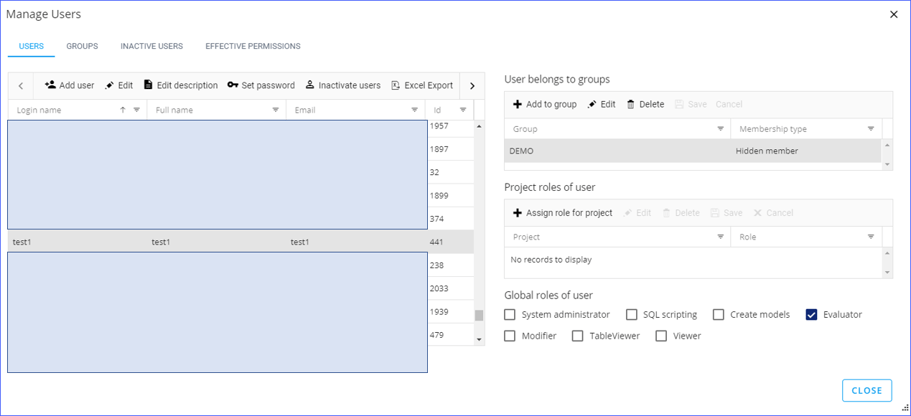
How to add/remove process mining users?
How to update the groups for users?
How to update the project-specific roles for users and groups?
How to review effective permissions?
QPR ProcessAnalyzer has an extensive set of user administration and management features, including full support for user groups, projects, projects specific roles and case-level permissions. With the 2020.8 enhanced web user interface it is easy for the administrators to Manage Users:
More info: https://devnet.onqpr.com/pawiki/index.php/Manage_Users_and_Groups_in_QPR_ProcessAnalyzer
How to extend your process mining solution?
QPR ProcessAnalyzer has a rich expression language that provides functions for many purposes. In this release we have added:
Thank you for your interest in QPR ProcessAnalyzer, 2020.8 😊
If you are already using QPR ProcessAnalyzer, go ahead and try these new features when you get a chance. If not, and if you are new to Process Mining, read more on this page. If you want to know more about QPR ProcessAnalyzer, don't hesitate to book a live demo.
Webinar Recording (46 mins)
Download Presentation Slides (in PDF)

Share Online

Most sales leaders know their CRM holds a goldmine of data—but turning that data into real business impact is another story. This is where process mining comes...

Practical ways companies are turning data into action... and why I’m writing about them now. Over the past several years, I’ve worked with companies navigating...

In the shifting landscape of enterprise technology, a quiet revolution is underway — one that reshapes how businesses understand and optimize their operations....

Why Snowflake Summit 2025 Signals a Turning Point for Process Mining I just returned from Snowflake Summit 2025, and it’s clear: we’re entering a new era of...
Featured Blog
Identifying inefficiencies, risks, and automation opportunities with process mining
“With QPR ProcessAnalyzer, we were able to analyze the process in 2-3 hours instead of three weeks“
Read more