

For Investors
Overview of QPR
We are a leading player in a Digital Twin of an Organization (DTO) use case and one of the most advanced companies in the world in process mining -software.
We innovate, develop, and deliver software for analyzing, monitoring, and modeling organizations’ operations. In addition, we offer consultancy services to ensure customers get full value out of the software and related methods. Our purpose is to help organizations reach their full operational potential.
Why invest in QPR Software?
- Our new strategy has a clear focus on scalable SaaS products for process mining. This enables a turnaround in growth and shareholder value development.
- The process mining market has high potential and is experiencing significant growth.
- We are a leading process mining player in the Nordics that is able to challenge global leaders with our unique technology.
- We have a competent management and board with experience of companies undergoing significant changes and of the development of software companies internationally.
- We have an extensive international customer base and an evolving partner ecosystem to support our growth targets described in our strategy.
Outlook for 2025
Global economic uncertainty and geopolitical tensions continue to pose challenges to the business environment, making long-term forecasting difficult.
In 2025, as part of its turnaround strategy, the company is shifting its focus to investing in growth and business development, which will impact profitability during the financial year. Growth will be driven primarily in the United States, Europe, and the Middle East, supported by the strengthening of the partner network.
The process mining market is evolving from a product-centric business model towards a platform economy. QPR ProcessAnalyzer is the only process mining solution designed for the Snowflake AI Data Cloud environment and is also available as an application on the Snowflake Marketplace. This opens new growth opportunities for the company, but achieving commercial breakthroughs will require time and investments.
Due to the nature of the business and long sales cycles, quarterly fluctuations may be significant. Growth in the first half of the year is expected to be moderate, as some legacy product customer contracts ended at the turn of the year.
The company forecasts that SaaS revenue will grow, and that the EBITDA will remain positive despite growth investments.
Updated 02/2025
Our Strategy
Mission, strategy, and markets
QPR Software’s mission is to innovate, develop and deliver software for analyzing, monitoring, and modeling the organizations’ operations. The company also offers consulting services to ensure that customers get full value from the software and related methods.
Strategic targets
On 14 December 2023, QPR Software Plc refined its current strategy to reflect market changes and the Company's priority areas, and announced renewed financial goals for the strategy period.
In accordance with the refined strategy, the Company profiles itself even more strongly as a software and SaaS player and as a consultant for its core business areas as well as a leading player in Digital Twin of an Organization (DTO) technology. The aim of the refined strategy is to further increase the value the Company produces for its customers and to support the Company's growth through concentration. The Company's mission is to innovate, develop and deliver software for analyzing, monitoring, and modeling the organizations’ operations. The Company also offers consulting services to ensure that customers get full value from the software and related methods.
In accordance with the adjusted strategy (2024–2027), the Company focuses its business on the international growth of SaaS solutions offered by Digital Twin of an Organization (DTO) and the process mining at its core. The Company's DTO offering also includes software developed for modeling and managing and measuring the organization's strategy and performance.
The Company's revised financial goals for the strategic period 2024–2027 are:
- Average twenty (20) percent annual SaaS growth,
and
- Sustainable operating profit.
The Company also continues to build new strategic partner networks in accordance with the strategy announced on March 10, 2022, to achieve a scalable Go-to-Market model, expand its own offering and improve the value it provides to its customers together with technology and implementation partners. The Company concentrates its growth investments in Europe and the Middle East and, through a partner network, on new market areas such as North America.
Our offering
We are a leading player in a Digital Twin of an Organization (DTO) use case and one of the most advanced companies in the world in process mining -software.
We innovate, develop, and deliver software for analyzing, monitoring, and modeling organizations’ operations.
In addition, we offer consultancy services to ensure customers get full value out of the software and related methods. Our purpose is to help organizations reach their full operational potential.
QPR product portfolio consists of the following software:
QPR ProcessAnalyzer
Powerful process mining platform supporting all use cases and globally the only process mining Powered by Snowflake software. QPR ProcessAnalyzer is now also available as an application at Snowflake Marketplace.
QPR Metrics
The leading strategy and performance management software with exceptional user experience
QPR EnterpriseArchitect
Enterprise modelling software enabling modelling and analysis of all different enterprise architecture dimensions
QPR ProcessDesigner
Easy to use enterprise level process modelling software with easy and attractive communication portal
Our markets
The Company reports the following geographical areas: Finland, the rest of Europe (including Turkey), and the rest of the world. The Company has closed its business and partnerships in Russia for the time being.
QPR has its own sales staff in Finland, and the United Arab Emirates. The Company concentrates its growth investments in Europe and the Middle East and, through a partner network, on new market areas such as North America.
The Company’s management estimates that the size of the process mining market in 2022 was approximately $1.1 billion. The management estimates that the market continues to grow at an average annual rate of around 49% and reach $28 billion by 2030. The demand for Digital Twin of an Organization technology is expected to grow with the development of the process mining market. The management estimates also that the modeling and organizational strategy and performance management software market is also around $1.0 billion. The market is quite mature but continues to grow at an average annual percentage rate of single digits.
Financial Information
Key Figures (IFFRS)

Consolidated Comprehensive Income Statement (IFRS)

Consolidated Balance Sheet (IFRS)

Consolidated Cash Flow Statement (IFRS)

Definition of Key Indicators
Return on equity (ROE), %:
(Profit for the period x 100) / (Shareholders' equity (average))
Return on investment (ROI), %
(Profit before taxes + interest and other financial expenses) x 100
Balance sheet total - non-interest bearing liabilities (average)
Equity ratio, %:
(Total equity x 100) / (Balance sheet total - advances received)
Gearing, %:
((Interest-bearing liabilities - cash and cash equivalents) x 100) / (Total equity)
Earnings per share, euro:
(Profit for the period attributable to the shareholders of the parent company) / (Weighted average number of shares outstanding during the year)
Equity per share, euro:
(Equity attributable to shareholders of the parent company) / (Number of shares outstanding at the end of the year)
Dividend per share, euro:
(Total dividend paid) / (Number of shares outstanding at the end of the year)
Dividend per profit, %:
(Dividend per share x 100) / (Earnings per share)
Effective dividend yield, %:
(Dividend per share x 100) / (Share price at the end of the year)
Price/earnings ratio (P/E):
(Share price at the end of the year) / (Earnings per share)
Market capitalization:
Total number of shares outstanding x share price at the end of the year
Turnover of shares, % of all shares:
(Number of shares traded x 100) / (Average number of shares outstanding during the year)
Annual Reports


Interim Reports
Financial Statement Bulletin January-December
Interim Report January-March
Half Year Financial report January-June
Interim Report January-September
Financial Statements Bulletin January-December
Interim Report January-September
Interim Report January-March
Half Year Financial Report January-June
Financial Statements Bulletin January-December
Interim Report January-September
Half Year Financial Report January-June
Interim Report January-March
Financial Statements Bulletin
Interim Report January-September
Half Year Financial Report January-June
Interim Report January-March
Financial Statements Bulletin January-December
Interim Report January-September
Half Year Financial Report January-June
Interim Report January-March
Financial Statements Bulletin January-December
Interim Report January-September
Half Year Financial Report January-June
Interim Report January-March
Financial Statements Bulletin January-December
Interim Report January-September
Half Year Financial Report January-June
Interim Report January-March
Financial Statements Bulletin January-December
Interim Report January-September
Interim Report January-June
Interim Report January-March
Share Information
- Trading code: QPR1V
- Number of shares, pcs: 19,850,578
- Share capital, EUR: 1,359,089.93
- Book counter value, EUR: 0.11
QPR Software Plc Stock Options 2024
The Board of Directors of QPR Software Plc has on September 9, 2024, resolved to launch a new stock option plan based on the authorization granted by the Annual General Meeting of the Company on May 15, 2024, under which key personnel of the Company and its subsidiaries (the “Group”) may receive stock options (the “Stock Option(s)”) entitling to subscribe for shares in the Company (the “Share(s)”).
There is a weighty financial reason for the issuance of the Stock Options as the Stock Options are intended to form a part of the incentive and commitment program of the Group’s key personnel. The purpose of the Stock Options is to encourage the key personnel to work on a long-term basis to increase shareholder value as well as to commit the key personnel to the Group as their employer.
Changes of addresses
If the address of a shareholder changes, we request to contact the custodian bank holding the shareholder’s book-entry account.
Flaggings
QPR Software Plc has received on June 3, 2025, a notification pursuant to Chapter 9, Section 5 of the Securities Markets Act from Anna Pöyry. According to the notification, Anna Pöyry’s indirect holding of shares and votes in QPR Software Plc fell below the threshold of five (5) percent on June 2, 2025. The decrease in holding resulted from the dissolution of the group structure between Umo Invest Oy and Umo Capital Oy and the related transfer of shares and voting rights.
Read the notification here: https://shorturl.at/gLCZj
QPR Software Plc has received on May 27, 2025, a notification pursuant to Chapter 9, Section 5 of the Securities Markets Act from Umo Capital Oy. According to the notification, Umo Capital Oy’s holding of shares and votes in QPR Software Plc fell below the threshold of five (5) percent on May 26, 2025, as a result of the transfer of shares and voting rights.
Read the notification here: https://shorturl.at/1EEps
Share capital
A total of 1,675,386 new shares subscribed for in QPR Software Plc’s directed share issue have been registered with the Trade Register maintained by the Finnish Patent and Registration Office on March 5, 2025. Following the registration, the total number of shares in the company is 19,850,578, of which 256,849 shares are held by the company.
The new shares carry equal rights with the company’s existing shares as of the registration date.
The new shares are expected to be admitted to trading on the official list of Nasdaq Helsinki Ltd approximately on March 6, 2025.
Major shareholders
Shareholder Agreements
The company is not aware of any shareholder agreements concerning the use of voting rights in the company, or of any agreements limiting the surrender of company shares.
Dividend Policy
The Board does not intend to propose distribution of dividends to the Annual General Meeting. Instead, it proposes to re-invest cash flow from operating activities into growth investments.
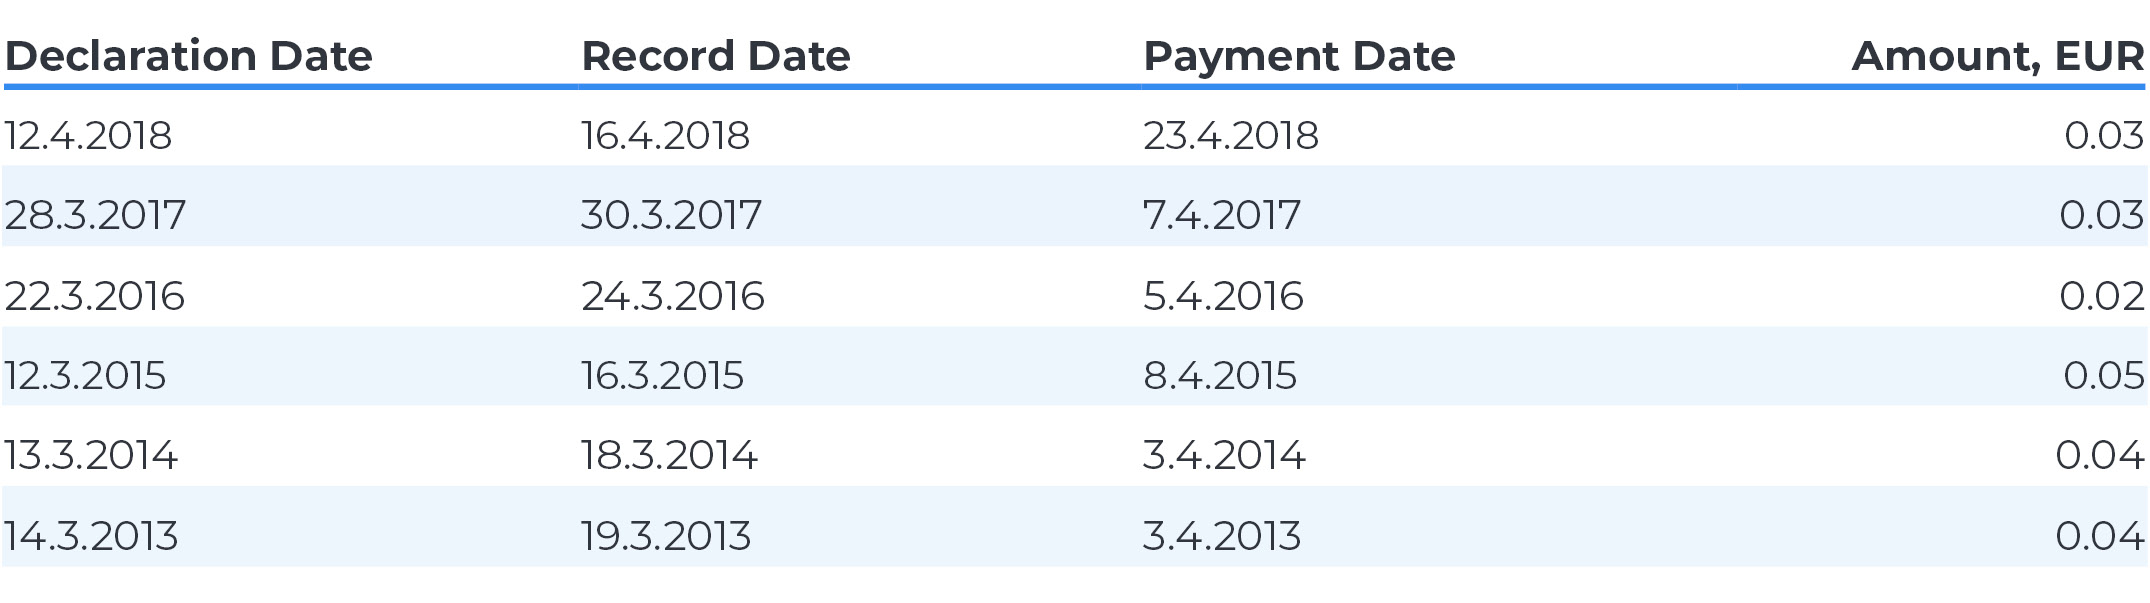
Dividend History
QPR Software Plc has not paid dividends since 2018. The company focuses on reinvesting earnings to support growth and innovation. Information on the company's dividend policy and any future dividend distributions is available in the latest Annual Report and Annual General Meeting materials.
Historical Dividends (2013–2018):
Corporate Governance
QPR Software Plc’s (QPR’s) management principles apply sound corporate governance and high ethical standards. They comply with the Finnish Limited Liability Companies Act, the Market Abuse Regulation and Securities Markets Act, QPR’s Articles of Association, other regulatory rules concerning the administration of public companies, as well as the Finnish Corporate Governance Code (effective as of January 1, 2020) and the Guidelines for Insiders (effective as of January 1, 2021) maintained by the Finnish Securities Market Association. The principles stated here are intended to only supplement legal provisions.
Information on compliance with the Corporate Governance Code
QPR Software Plc complies with the Corporate Governance Code 2020, issued by the Finnish Securities Market Association, from the beginning of the financial year starting on January 1, 2020.
Deviation from recommendations
QPR Software complies with the Finnish Corporate Governance Code with the following exception: the Board of Directors has not established any committees. There are no separate committees, as the Board has not considered these necessary considering the size of the Group, the extent of the operations and existing monitoring systems. The Board as a whole is responsible for fulfilling the tasks of an audit committee and other committees.
The company's Board of Directors consists of four members, each representing a well-defined competence profile. The Board includes representatives of both genders. When selecting the most recent Board, it was ensured that the chosen members fulfilled both the target profiles and the company’s diversity objectives. The Board’s composition is reviewed annually, and QPR Software remains committed to advancing gender equality going forward.
Availability of the Corporate Governance Code on the Internet
The Finnish Corporate Governance Code is publicly available on the website of the Finnish Securities Market Association, at www.cgfinland.fi.
Board of Directors
The Annual General Meeting elects three to six Board members for a term of one year at a time. Board members consist of representatives of major shareholders and external, independent experts with broad experience in business and the industry in which QPR operates. The AGM confirms annually in advance the emoluments payable to the members of the Board of Directors. The Board elects a Chairman from among its members.
Major shareholders prepare annually a proposal to the Annual General Meeting for the composition of the Company’s Board of Directors as well as well for the annual emoluments of the Board members and auditors. The Chairman of the Board is responsible for contacting major shareholders and inviting at least three largest shareholders annually to prepare the proposals.
QPR's Board of Directors is responsible for the company's strategic policies and the appropriate organization of business operations and administration. The Board of Directors acts in the company's interests in all situations. The Board has a predetermined agenda. The Board of Directors always handles and decides on matters that are financially, commercially or fundamentally significant for the company's operations. At each Board meeting, the Board shall consider a progress report provided by the CEO. In line with the standard agenda, the Board also monitors sales performance and market development at all Board meetings. QPR's CEO attends Board meetings and presents items on the agenda to the Board. The external legal advisor acts as the Board's recording secretary.
QPR's Board of Directors shall, in accordance with its agenda:
- confirm the company's long-term goals and strategies;
- make decisions on Group structure and organisation;
- handle and adopt interim reports, consolidated financial statements and the annual report;
- confirm the Group's operating plan, budget and investment plan:
- make decisions on strategically or financially important individual investments, company acquisitions, disposals or other arrangements, and contingent liabilities;
- decide on strategically significant product development projects;
- confirm the Group's risk management and reporting practice;
- make decisions on reward and incentive schemes for Group management;
- establish a dividend policy and be responsible for the development of shareholder value;
- appoint the company's Managing Director and determine his remuneration; and
- be responsible of other duties determined for the Board of Directors in the Companies Act or otherwise.
The work of the Board of Directors is organized as effectively as possible to support the proper functioning of the company's administrative and control systems. So far the Board of Directors as a whole has familiarized itself in advance and been involved in the preparation of many matters for which separate committees are set up in large companies. This is because the scope of the company's activities has not yet required the establishment of separate committees - instead the entire Board has been involved in the preparation of all matters within its authority and belonging to its duties.
The Board of Directors regularly assesses its operations and working procedures by carrying out a self-assessment once a year. Information about the number of meetings and attendance at the meetings of QPR's Board of Directors is available in most recent annual report.
See the members of the QPR Software Plc's Board of Directors.
QPR Software Plc’s Annual General Meeting decides on the annual emolument of the Board of Directors. Up to date information is available in QPR Software's Remuneration Statement and in resolutions made by the Annual General Meeting.
No retirement age is set or any exceptional pension arrangements is provided for the Board members.
Updated 08/2023
Operational Management
Chief Executive Officer
The CEO's duty is to manage the company's activities in accordance with the Finnish Companies Act and the Board of Directors' instructions and rules and to inform the Board of Directors about the development of the company's business and financial situation. The CEO is also responsible for arranging the company's day-to-day administration and ensuring that the financial administration of the company has been arranged reliably. The CEO primarily presents matters in Board meetings and is responsible for preparing draft solutions.
QPR's Board of Directors appointed Heikki Veijola the CEO on January 2nd, 2023.
Principles of compensation
QPR's Board of Directors appoints the CEO and decides the terms of his/her service contract. The CEO's terms of service have been agreed on in writing. The CEO is not appointed for a certain term, but is appointed indefinitely until further notice is given. The Company does not have any differing pension arrangements for the CEO. The period of notice for the CEO is three months. Compensation on termination is equivalent to six months' salary.
QPR Software Plc does not have any share based incentive schemes.
Executive Management Team
QPR has an Executive Management Team, the Chairman of which is QPR's CEO and the members who are Senior Vice Presidents (SVP) responsible for the company's business operations and business units and corporate support functions. The Executive Management Team can be expanded if this is considered necessary for the matter under consideration.
The Executive Management Team's main responsibility is to assist the CEO, monitor and develop the company's business in line with the objectives set, and disseminate information. The Executive Management Team is informed about all business plans, profit performance and majority of the matters that are handled by QPR's Board of Directors, and it also participates in the preparation of these matters as appointed by the CEO. The Executive Management Team meets once a month.
See the members of the QPR Software Executive Management Team.
Principles of compensation
QPR's Board of Directors makes decisions on the salary benefits of the members of the Executive Management Team. The employment agreements of the members of the Executive Management Team are based on the collective agreement in force, including the periods of notice thereto. The Executive Management Team members have no differing arrangements related to the termination of their contract or any differing pension arrangements.
Information about compensation and bonus system is available in QPR Software's remuneration statement.
QPR Software Plc does not have any share based incentive schemes.
Updated 03/2023
Insiders
QPR Software’s Insider Guidelines include Nasdaq Helsinki Ltd’s Guidelines for Insiders of Listed Companies (January 1, 2021) and the Market Abuse Regulation (MAR). Both documents are part of QPR’s guidelines unchanged. The QPR Insider Guidelines set trade restrictions prohibiting Persons Discharging Managerial Responsibilities (PDMRs), permanent insiders and event-based insiders from making transactions with QPR’s securities during a closed period of 30 days before a financial report is made public. The closed period ends on the day after the publication of a financial report. According to QPR’s Insider Guidelines, permanent insiders must notify the CEO and the Chairman of the Board about the intention to trade QPR’s securities prior to executing a transaction.
The CEO, members of the Board of Directors and the executive management team are considered PDMRs – this is because they are regularly exposed to inside information and have the right to make decisions regarding the future of QPR. QPR’s permanent insiders include employees or other outsourced persons that due to their position or the nature of their responsibilities have access to inside information.
In case QPR prepares an event that could significantly impact the company’s value (e.g. a corporate acquisition), an event-based insider list must be created for the project. Event-based insiders are persons that contractually work for QPR either directly or indirectly and have access to inside information; as well as any organization that is provided inside information on the project.
QPR's CFO manages insider issues and supervises compliance with QPR’s Insider Guidelines. The CFO also maintains QPR’s insider register.
QPR Software Plc’s managers and their closely associated persons referred to in the MAR regulation have been requested to notify their transactions as of July 3, 2016.
Updated 12/2020
Control Systems
Internal control
Internal control and risk management in the Group aims to ensure that the Group operates efficiently and effectively, distributes reliable information, complies with regulations and operational principles, reaches its strategic goals, reacts to changes in the market and operational environment, and ensures continuity of its business.
It is the duty of the Board of Directors to monitor the appropriateness, effectiveness and efficiency of risk management and internal control in QPR Software Group.
The threat caused by the risks to shareholders is used as a criterion when the Board of Directors evaluates these risks. The Board of Directors also monitors that the Company has defined operational principles for internal control and that the Company monitors the effectiveness of internal control.
Risk management
Coordination of risk management and internal control and the related reporting is the responsibility of the Chief Financial Officer. Risk management in QPR Software is guided by the requirements of legislation, shareholders’ expectations regarding business objectives, and expectations among important stakeholders, such as customers and personnel.
Risk management in QPR Software aims systematically and comprehensively to identify risks related to the Company’s operations and ensures that risks are managed and taken into account in decision-making. The Company does not have a separate risk management organization, and risk management is part of routine responsibilities throughout the organization. Risk management is developed by constantly improving operative processes in the Company.
QPR Software identifies the risks by their materiality: if realized, the risks selected for monitoring would have a material impact on the Company's business operations.
QPR has identified the following three groups of risks related to its operations:
- risks related to business operations,
- risks related to information and products, and
- risks related to financing.
Property, operational and liability risks are covered by insurance.
QPR Software Plc’s Management System has received ISO 9001:2015 quality certification covering the Company’s all activities, which is audited annually by an external party.
ISO 27001 Information Security Certification has been awarded to QPR Software for design, marketing, and delivering software services and solutions.
The ISO 27001 International Standard has been prepared to provide requirements for establishing, implementing, maintaining, and continually improving an information security management system. The information security management system preserves the confidentiality, integrity, and availability of information by applying a risk management process and gives confidence to interested parties that risks are adequately managed.
For more information on risk management in QPR Software, please see the latest Corporate Governance Statement.
Updated 03/2023
Articles of Association
1 § Company name and domicile
The company name is QPR Software Oyj, in English QPR Software Plc. Company's domicile is Helsinki.
2 § Field of Business
The field of business of the company is to develop and sell data processing systems that increase the efficiency of the organizations and provide additional value to the clients. The company acts as the parent company of the group and is responsible for the financing of the group. Furthermore, the company may own and administer shares and real estates and other property supporting its business operations.
3 § Book-entry Securities System
The company's shares are included in the book-entry securities system.
4 § Board of Directors
The Board of Directors shall consist of three to six (3-6) ordinary members.
The term of the members of the Board of Directors shall terminate at the end of the Annual Shareholders' Meeting following the election of the Board of Directors.
5 § Representation
The company is represented by the chairman of the Board of Directors and the managing director each alone and a member of the Board of Directors, holder of a procuration or another person appointed by the Board of Directors to represent the company two together.
The Board of Directors is entitled to give a right to represent the company to appointed persons in the manner that they are entitled to represent the company two together or each together with a member of the Board of Directors or a holder of a procuration.
6 § Auditor
The company has one (1) auditor, which is required to be an auditing company approved by the Central Chamber of Commerce. The auditor is elected until further notice.
7 § Financial Period
The financial period of the company is a calendar year.
8 § Notice for Annual General Meeting
The notice of a General Meeting must be published on the website of the company no earlier than three months prior to the record date of the Meeting under Chapter 4, section 2, Subsection 2 of the Companies Act and no later than three weeks prior to the Meeting, provided that the date of the publication must be at least nine days prior to the aforesaid record date. To be able to participate in a General Meeting, a shareholder must register with the company no later than on the day mentioned in the notice of Meeting, which may be no earlier than ten (10) days before the Meeting.
9 § Annual General Meeting
The Annual Shareholders' Meeting shall be held annually in Helsinki, Espoo or Vantaa on the date decided by the Board of Directors, within six months of the expiration of the financial period on a date set by the Board of Directors.
In the meeting the following shall be submitted:
- financial statements, group financial statements and annual report
- auditor's report.
The following matters shall be decided upon:
- confirmation of the financial statements and the group financial statements
- use of the profit shown by the balance sheet
- discharge of liability of the members of the Board of Directors and the Managing Director
- compensation for the members of the Board of Directors and the auditors as well as grounds for compensation of the costs incurred
- amount of members in the Board of Directors
The following shall be elected:
- the members of the Board of Directors; and
- the auditor, when required.
Updated 02/2018
Auditors
According to the Articles of Association, QPR Software Plc has a minimum of one and a maximum of two auditors elected by the Annual General Meeting. The auditor is elected into his duties for the time being. At least one of the auditors shall be an auditor authorised by the Central Chamber of Commerce.
The company's auditors provide shareholders with a report, as required by law, in conjunction with the company's annual financial statements. The primary aim of the statutory audit is to verify that the financial statements give a true and fair view of the company's financial performance and position for each fiscal year. QPR's financial year is the calendar year. In addition to the auditor's report provided with the annual financial statements, the auditor's report on their findings to the company's Board of Directors and Management continuously and always in connection with each interim report.
The auditor participates at least once a year in a meeting of the Board of Directors to provide for a review of the auditing plan and the results of the audit. In addition, the auditor is present at the company's Annual General Meeting and at company's extraordinary shareholder's meetings if required.
The Annual General Meeting 2025 of QPR Software Plc elected Ernst & Young Oy, Authorised Public Accountants, as the Company’s auditor. Ernst & Young Oy has announced that Maria Onniselkä, Authorised Public Accountant, will serve as the principal auditor.
Compliance
We want to do right!
QPR’s company culture is based on high business ethics and company values that guide our operations. Our company strives to maintain a transparent business climate and high business ethics. We value the safety and respect of everyone affected by our business.
QPR complies with all applicable laws and regulations and unconditionally supports and promotes human rights. Whenever any kind of violation of our values and policies is distinguished, it should be reported to QPR immediately.
You have a vital role in our success!
Whistleblowing provides an opportunity to report suspicions of misconduct. Our whistleblowing service is an early warning system to reduce risks. It is an important tool to foster high business ethics and maintaining customer and public confidence in us.
You may blow the whistle to the QPR Compliance Committee. The identity of the person making the report will be anonymous. All notices of suspected incidents are investigated by the committee. The committee will respond to the reporting person within 30 business days of reporting the violation.
Any QPR employee who makes a whistleblowing report is protected from any repercussions, such as dismissal and other forms of reprisals. QPR protects the personal data of the reporting person and the person who is allegedly responsible for the breach.
Reported non-compliances may be, for example:
- Unprofessional business relations
- Unfair competition
- Market manipulation
- Unlawful disclosure of insider information
- Conflicts of interest
- Misuse of company assets
- Violation of human rights and equality
- Breach of trust and privacy
To ensure that issues do not escalate to the point where they become a whistleblowing case, QPR focuses on communicating the company’s values as well as rules and regulations set for a public listed company and encourages open communication.
The QPR Compliance Committee meets regularly once in a quarter, or as required to handle any reported cases within the set time limits.
Updated 02/2018
Corporate Governance Statements
Corporate Governance Statement 2024
Corporate Governance Statement 2023
Corporate Governance Statement 2022
Corporate Governance Statement 2021
Corporate Governance Statement 2020
Corporate Governance Statement 2019
Corporate Governance Statement 2018
Corporate Governance Statement 2017
Corporate Governance Statement 2016
Corporate Governance Statement 2015
Corporate Governance Statement 2014
Corporate Governance Statement 2013
Annual General Meeting
QPR's highest decision-making body is the shareholders' meeting, at which the shareholders participate in the control and supervision of the company. The shareholders' meeting is convened at least once a year.
The Annual General Meeting (AGM) shall be held within six months following the end of the fiscal year. Materials relating to matters to be considered at the shareholders' meeting can be inspected in advance at the company's head office in Helsinki.
The AGM shall decide the number of members on the Board of Directors and appoint Board members. In addition, it has the authority under the Finnish Companies Act to alter the Articles of Association, adopt the financial statements, determine the amount of dividends and select the auditors. Each QPR share entitles its holder to one vote at shareholders' meetings. QPR's Articles of Association have no redemption clauses or voting limitations.
Annual General Meeting 2025
The Annual General Meeting of QPR Software Plc was held on Wednesday, June 18, 2025, starting at 1:00 p.m. EEST at the Company’s headquarters, Keilaranta 1, 02150 Espoo.
Annual General Meeting Minutes
Resolutions of the Annual General Meeting
Notice to Annual General Meeting
Data Protection Statement
Annual Report 2024
Remuneration Report 2024
Power of Attorney
CV Maija Hovila
Annual General Meeting 2024
The Annual General Meeting was held on Wednesday 15, 2024 starting at 1:00 p.m. EEST at the Company’s headquarters Huopalahdentie 24, 00350 Helsinki, Finland.
Annual General Meeting Minutes
Notice to the Annual General Meeting
Resolutions of the Annual General Meeting
QPR Remuneration Policy
QPR Remuneration Report 2023
Data Protection Statement
Proxy Document
CV Linda von Schantz
Annual General Meeting 2023
The Annual General Meeting will be held on May 3, 2023 starting at 2.30 p.m. at the Company’s headquarters Huopalahdentie 24, 00350 Helsinki, Finland.
Related material:
Annual General Meeting minutes
Resolutions of the Annual General Meeting
Notice to the Annual General Meeting
QPR Remuneration Policy
QPR Remuneration Report 2022
Data Protection Statement
Proxy Document
Annual General Meeting 2022
The Annual General Meeting took place on April 6, 2022.
Related material:
Notice to the Annual General Meeting
QPR Remuneration Policy
QPR Remuneration Report 2021
Proposals of the Board of Directors
Shareholders' Nomination Board Charter
Data Protection Statement
Answers to Questions sent in Advance by Shareholders
Video: CEO's review
Resolutions of the Annual General Meeting and the organizing meeting of the Board of Directors
Annual General Meeting 2021
The Annual General Meeting took place on Thursday, March 25, 2021.
Number of shares and votes on the day of notice for Annual General Meeting, March 4, 2021.
- Shares: 12,444,863
- Votes: 12,444,863
QPR Software has one share category. Each share has one vote.
Related material:
Notice to the Annual General MeetingQPR Remuneration Policy
QPR Remuneration Report 2020
Board Candidates 2021
Authorization on Conveyance of Own Shares
Resolutions of the Annual General Meeting 2021
Annual General Meeting 2020
The Annual General Meeting was held on Monday, June 8, 2020.
Number of shares and votes on the day of notice for Annual General Meeting, May 15, 2020.
- Shares: 12,444,863
- Votes: 12,444,863
QPR Software has one share category. Each share has one vote.
Related material:
Notice to Annual General Meeting; Proposals of the Board of DirectorsResolutions of the Annual General Meeting 2020
CEO's Review
Annual General Meeting 2018
The Annual General Meeting was held on Thursday, 12 April, 2018.
Number of shares and votes on the day of notice for Annual General Meeting, 15 February, 2018.
- Shares: 12,444,863
- Votes: 12,444,863
QPR Software has one share category. Each share has one vote.
Related material:
Notice for the Annual General Meeting 2018Resolutions made by the Annual General Meeting 2018
Annual General Meeting 2018 - CEO's Review
Annual General Meeting 2017
The Annual General Meeting was held on Tuesday, 28 March, 2017.
Number of shares and votes on the day of notice for Annual General Meeting, 16 February, 2017.
- Shares: 12,444,863
- Votes: 12,444,863
QPR Software has one share category. Each share has one vote.
Related material:
Notice for the Annual General Meeting 2017Resolutions made by the Annual General Meeting 2017
Annual General Meeting 2017 - CEO's Review
Annual General Meeting 2016
The Annual General Meeting was held on Tuesday, 22 March, 2016.
Number of shares and votes on the day of notice for Annual General Meeting, 11 February, 2016.
- Shares: 12,444,863
- Votes: 12,444,863
QPR Software has one share category. Each share has one vote.
Related material:
Notice for the Annual General Meeting 2016Resolutions made by the Annual General Meeting 2016
Annual General Meeting 2016 - CEO's Review
Annual General Meeting 2015
Number of shares and votes on the day of notice for Annual General Meeting, 6 February, 2015.
- Shares: 12,444,863
- Votes: 12,444,863
QPR Software has one share category. Each share has one vote.
Related material:
Notice for the Annual General Meeting 2015Resolutions made by the Annual General Meeting 2015
Annual General Meeting 2015 - CEO's Review
Annual General Meeting 2014
Number of shares and votes on the day of notice for Annual General Meeting, 7 February, 2014.
- Shares: 12,444,863
- Votes: 12,444,863
QPR Software has one share category. Each share has one vote.
Related material:
Notice for the Annual General Meeting 2014Resolutions made by the Annual General Meeting 2014
Annual General Meeting 2014 - CEO's Review
Instructions for managers' transactions
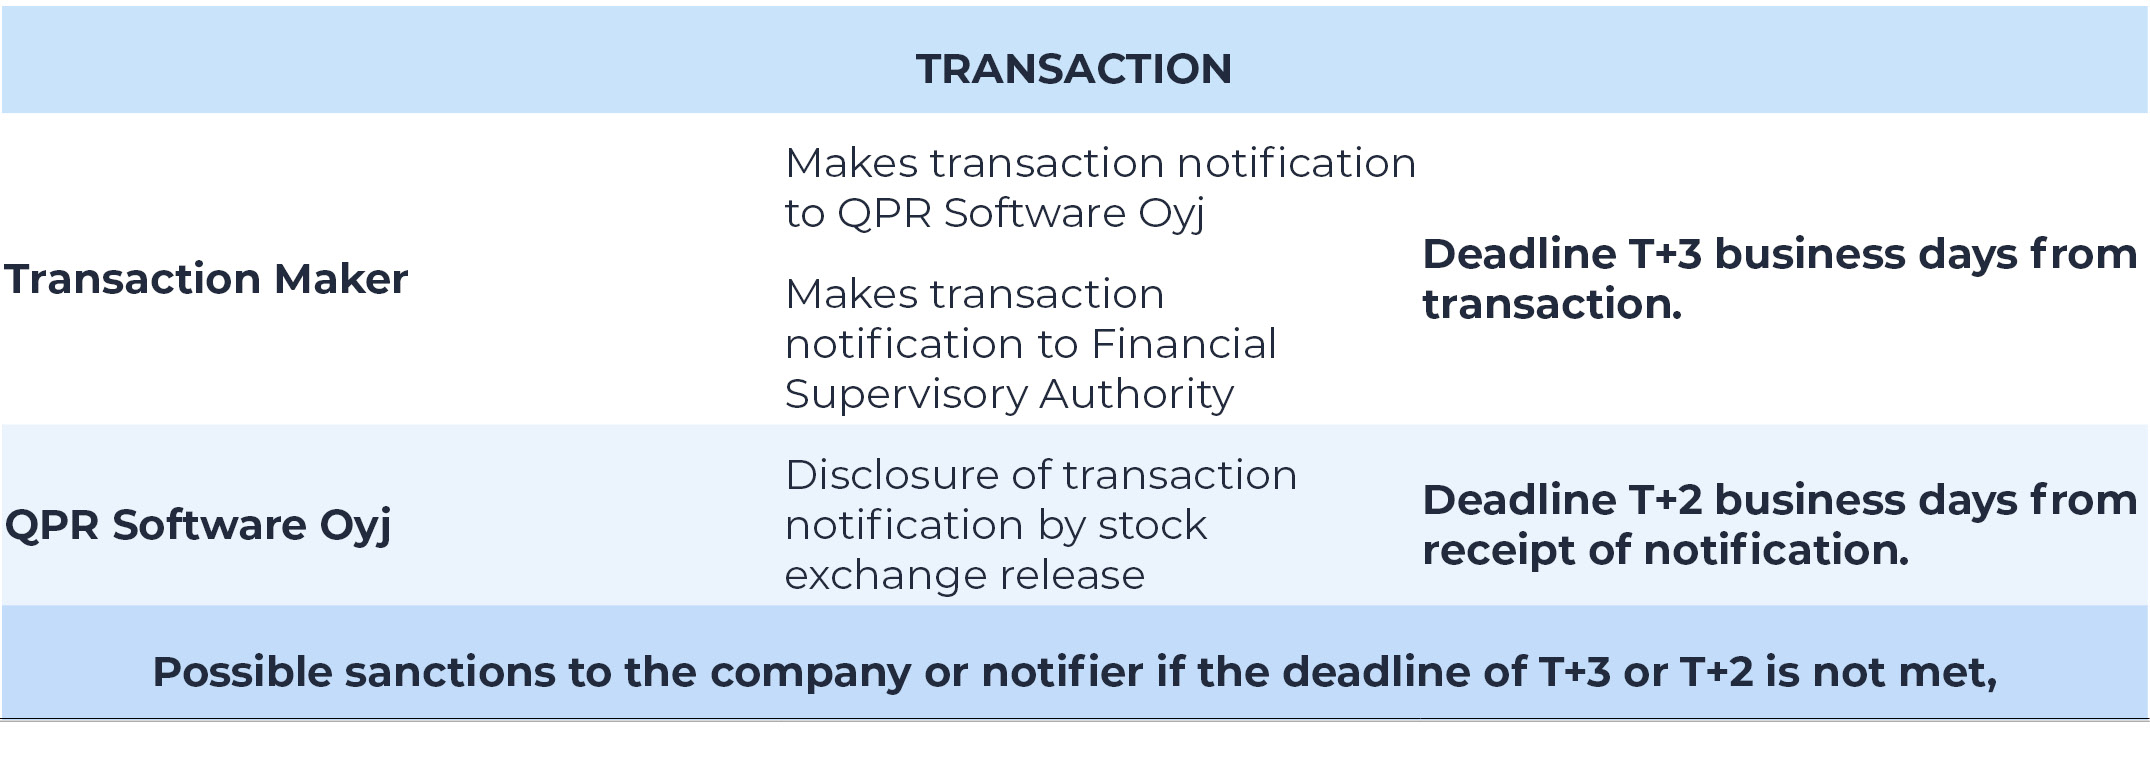
QPR Software’s managers and their closely associated persons referred to in the Market Abuse Regulation (EU) No 596/2014, ”MAR” are requested to follow the below instructions for notifying transactions:
According to the regulation, the notifications shall be made to QPR Software Oyj and the FIN-FSA promptly and no later than three business days after the date of the transaction (T+3).
Instructions for filling the transaction notification form from 13 October 2021 onwards
1. Go to https://asiointi.finanssivalvonta.fi/en/login and follow the instructions on the page to log on to the online service of the Finnish Financial Supervisory Authority.
2. Choose "Managers' Transactions" and fill in the form. Instructions are available at the Finnish FSA's website. Other information needed on the form is available below on this page.
3. PLEASE NOTE that before you send the online form to the Finnish FSA, you need either to copy the information on step "Summary - Show plain language summary" (remember to copy both Finnish and English summary!) or download a PDF file in order to send the required information also to QPR. Instructions to copy the information and download the PDF are available on the Finnish FSA's online form.
4. Send the information on the form to QPR Software to the following addresses: sanna.salo@qpr.com, taru.makinen@qpr.com, heikki.veijola@qpr.com. You may either copy the information to the email or attach it as a PDF file (see point 3. above).
Please also add your phone number to the e-mail message so that we can contact you if QPR has questions about the notification.
In case of any problems, please contact sanna.salo@qpr.com or ask for advice directly from the Financial Supervisory Authority tel: 0918351 (weekdays from 9 am to 4 pm).
Further information on the regulation concerning the notifications of transactions of managers and persons closely associated with them is available at Financial Supervisory Authority website.
QPR Software Plc’s transaction notifications of the managers and their closely associated persons can be reviewed here.
Investor Calendar and IR Contacts
Financial information 2025
In 2025, QPR Software Plc will publish three interim reports as follows:
- Interim Report for January–March 2025 on Thursday, April 24, 2025
- Half-year Financial Report for January–June 2025 on Friday, July 18, 2025
- Interim Report for January–September 2025 on Friday, October 31, 2025
QPR Software’s financial statement bulletin, activity report, audit report, and report on the corporate governance system for the financial year 2024 will be published on Friday, February 14, 2025.
The annual report for 2024 will be published on Friday, April 3, 2025.
Annual General Meeting 2025
The shareholders of QPR Software Plc are invited to the Annual General Meeting, which will be held on Wednesday, June 18, 2025, starting at 1:00 p.m. EEST at the Company’s headquarters, Keilaranta 1, 02150 Espoo. Registration of attendees who have signed up for the meeting and coffee service will begin at 12:30 p.m. EEST.
Please register and view the related AGM materials under Annual General Meeting 2025 section.
QPR Investor Relations contacts:
Heikki Veijola, Chief Executive Officer
Taru Mäkinen, Chief Financial Officer
Sanna Salo, Chief Marketing Officer
Email addresses are in the form firstname.lastname@qpr.com
QPR Software Plc, Tel. +358 290 001 150
Contact QPR IR function by email: finance[at]qpr.com
Stock Exchange and Press Releases
Watch QPRSoftware's Redeye Investor Event Presentation
At the event, Our CFO, Mervi Kerkelä-Hiltunen gave a successful presentation of QPR Software as a compelling investment opportunity.

See Mervi´s video here!