
How to choose the right process mining vendor for your business
Process mining is critical for businesses that want to optimize their operations, reduce costs, and improve customer satisfaction. However, choosing the best...

QPR ProcessAnalyzer 2020.4 provides predefined digital transformation charts, enhanced support for Process Mining Applications and several Expression Language Improvements. Read more to learn about these new functionalities that will improve your organization's process mining journey!
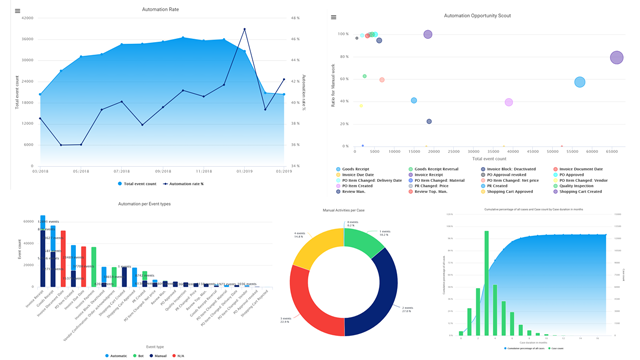
These 9 new Digital Transformation Charts speed up any process mining initiative. All charts can be further customized by adding your own dimensions, selections and what-if scenario capabilities.
How many manual events are needed to complete a case?
The core objective of digital transformation is to reduce the amount of manual work. This chart lets you monitor the outcome of your new digital business models, robotic automation (RPA) initiatives and systematic efficiency improvements by showing the average amount of manual events needed to complete one individual case.
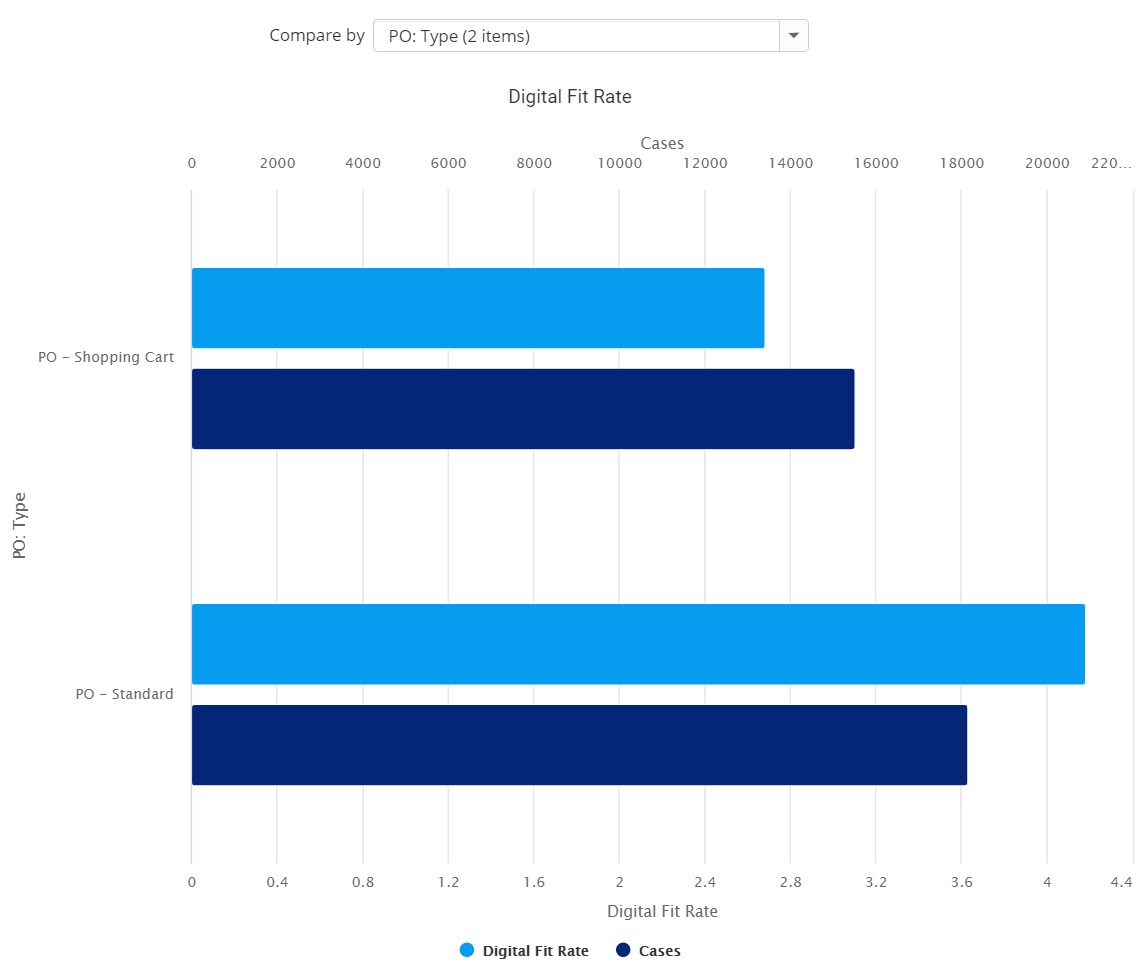
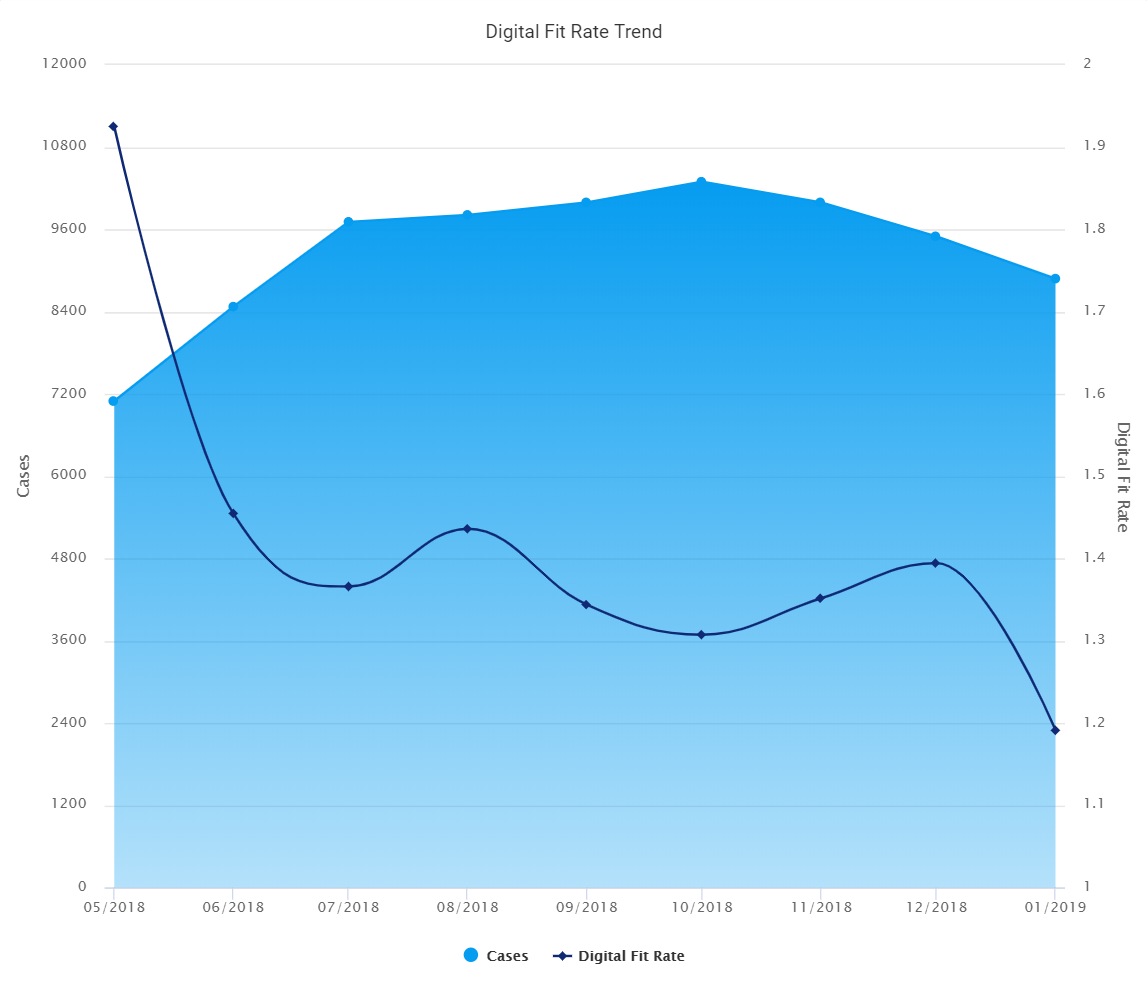
How to identify business areas with manual operations?
Digital Fit is the most important KPI for monitoring digital transformation. With this chart, you can benchmark your business using any available attribute - for example the Purchase Order Type - to identify areas with high amounts of manual events per case.
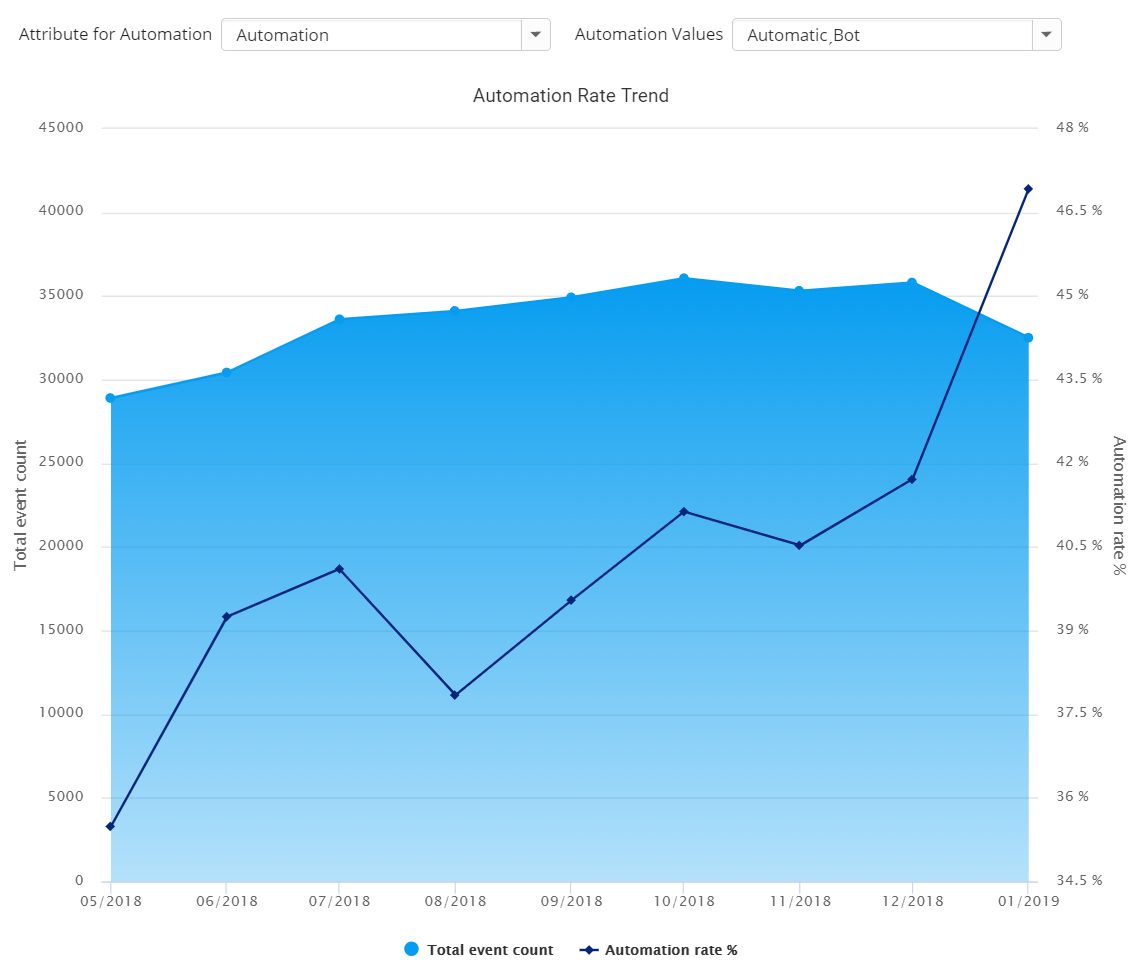
What is your end-to-end automation rate today and is it improving?
Automation Rate Trend shows the progress and results of your RPA and automation efforts as a monthly trend. It is easy to see how your automation rate is increasing as a result of RPA activities. However, if the automation is not working as it should, then the amount of other manual tasks within the process starts to increase. This is often caused by rework, manual work for fixing events performed by bots, and manual work based on customer complaints.
With this chart, you get a quick overview of your automation progress within the end-to-end process. QPR ProcessAnalyzer provides visibility to your end-to-end automation rate over time.
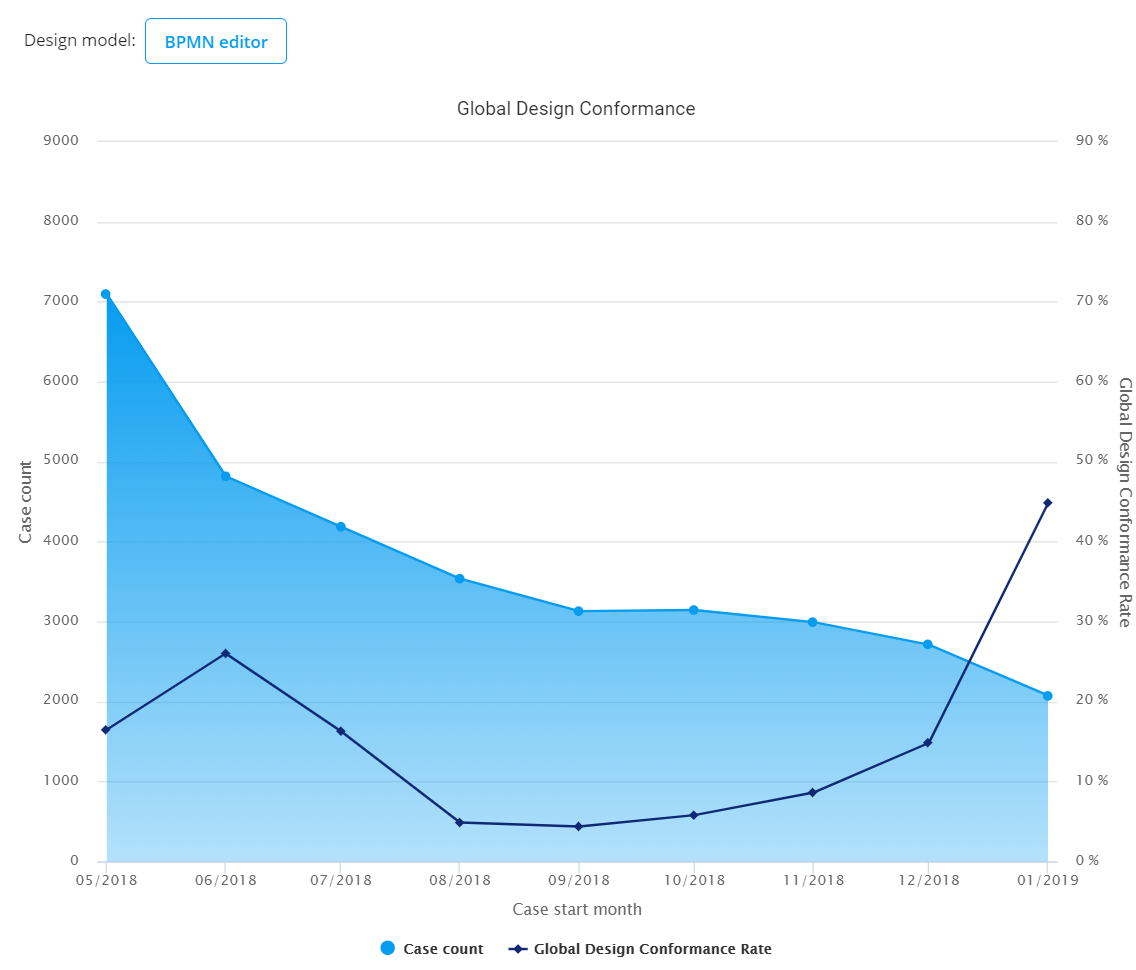
Digital transformation changes the way your organization works. This change is visible in the automatically discovered as-is process flowcharts. This chart lets you monitor the change at a high level, comparing the actual as-is processes with your intended designed process models. The analogy is clear: for any BUSINESS KPI you should set a TARGET VALUE. For every business PROCESS, you should define a DESIGN MODEL. This charts runs the conformance analysis to discover how large a share of your operations (process cases) complies with the design model.
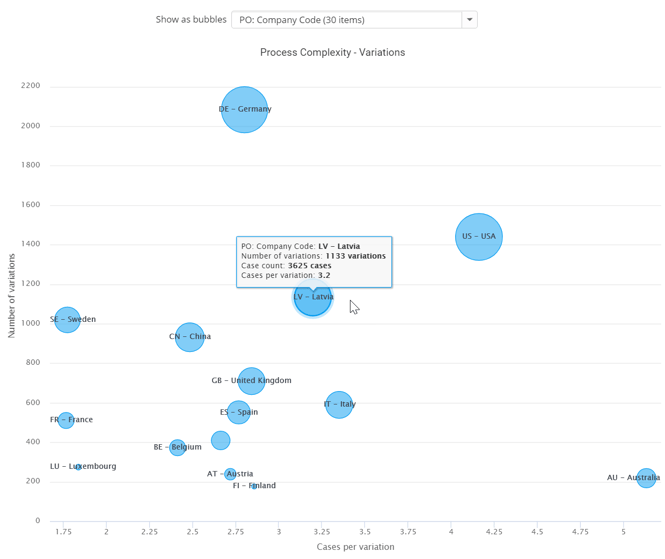
Benchmark business areas by process complexity.
Complexity makes thing difficult, slow and expensive. Unnecessary complexity is always bad. This chart benchmarks your operations using any available case attribute to present the level of complexity included in that business area. Large business areas with many cases naturally have more process variations, so the best performing areas are those with high amount of cases per each variation.
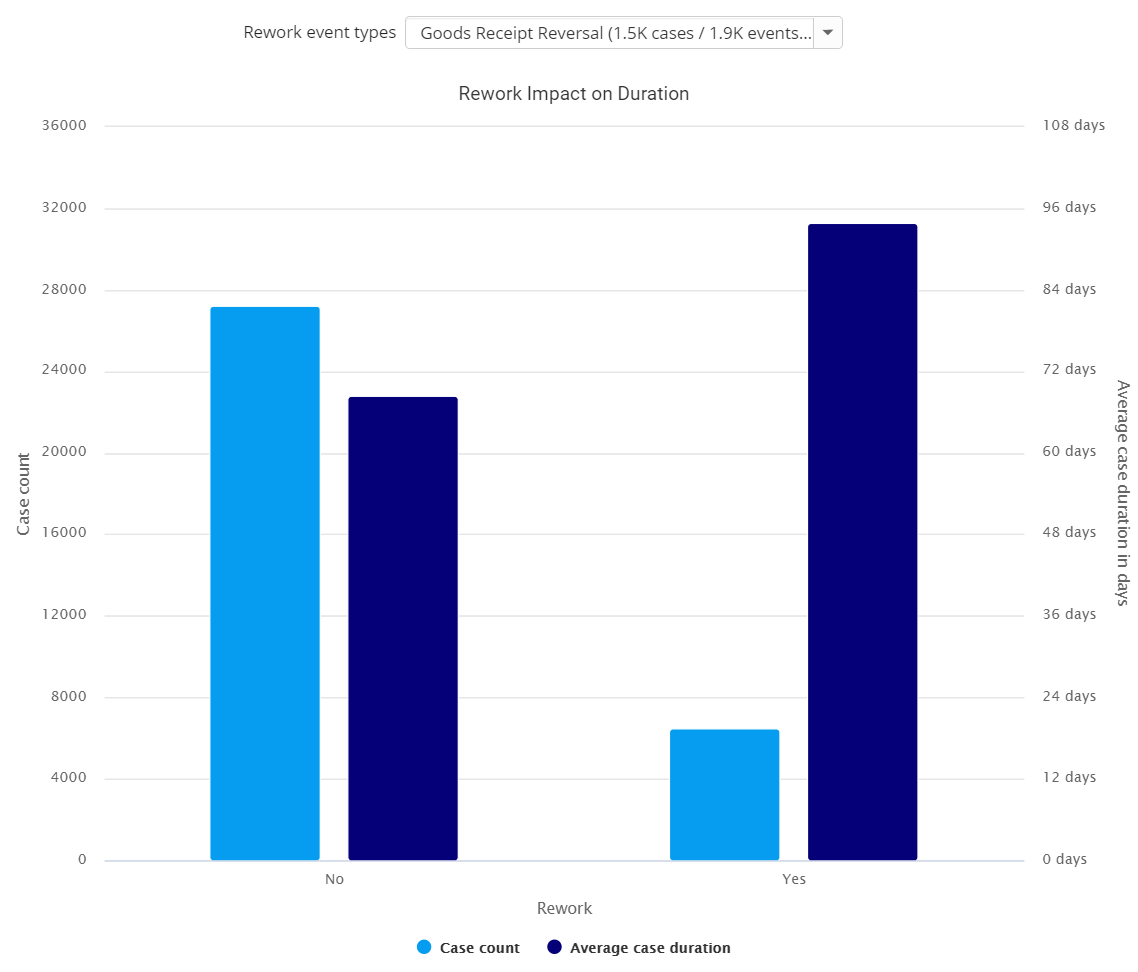
Analyze the effect of rework to process lead times.
Rework slows down the process - and customers don't like waiting. This chart shows how the average case duration is longer if any rework event has been conducted during the case. Use this chart to calculate your return on investment for reducing rework - and monitor your on-going digital transformation initiatives.
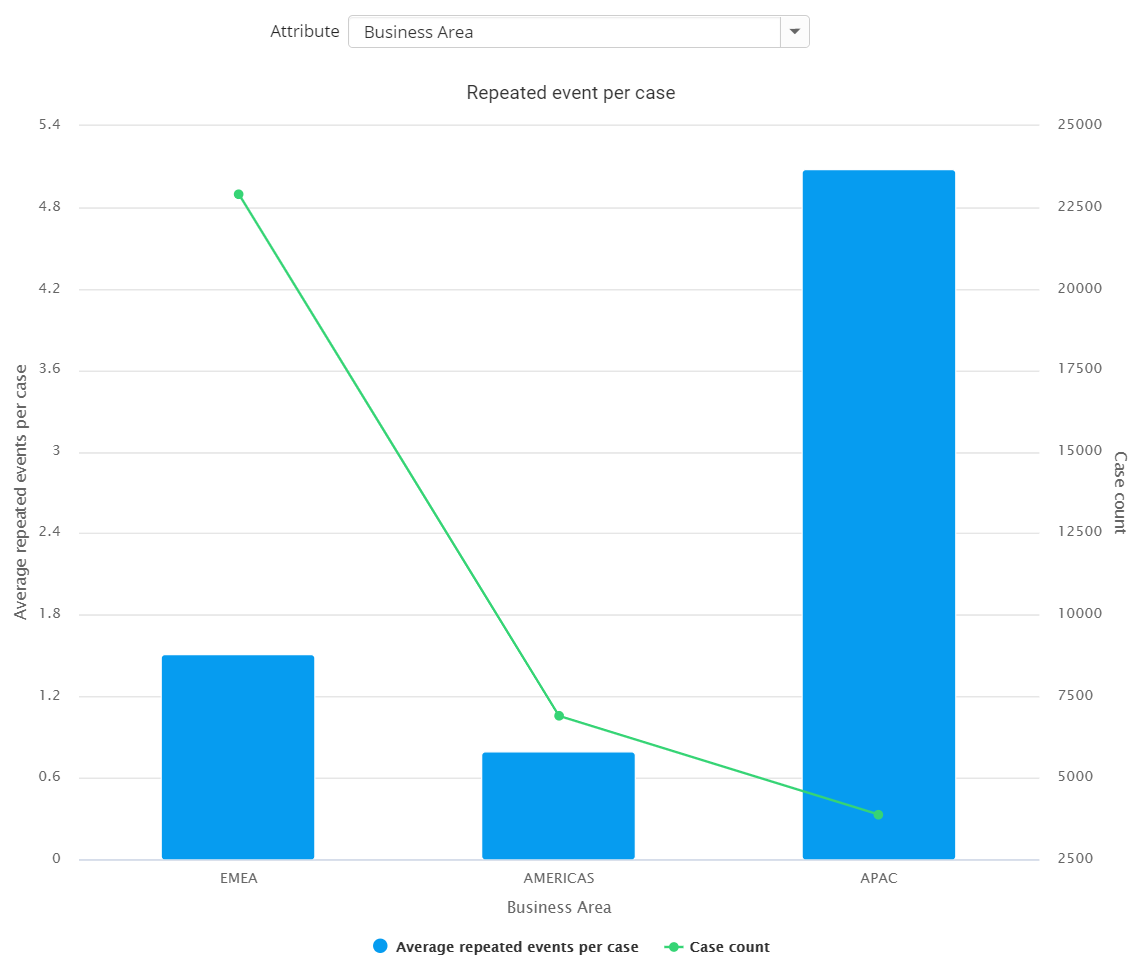
Detect business areas with high amount of repeating events.
If First-Time-Right is your goal, then this chart is perfect for you! Benchmark your business areas by the average amount of repeated events per case to improve problematic areas by giving them best practice examples from other areas.
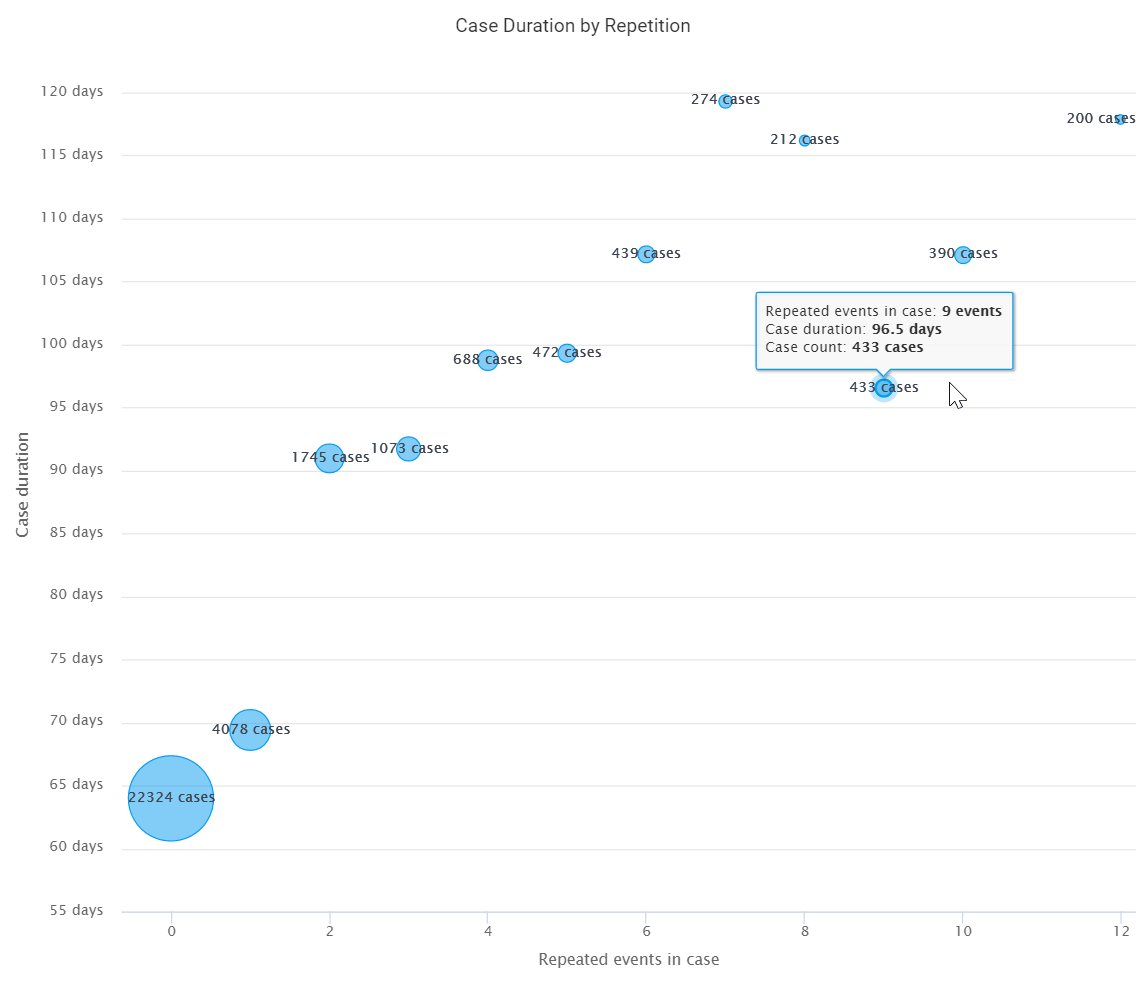
Analyze the effect of repetition on process lead times.
Repeating the same events multiple times causes high lead times. This chart shows the effect of multiple repeated events on the total end-to-end case duration. Cases with 10+ repeated events may easily take twice as much time to complete than cases without any repeating events! :)
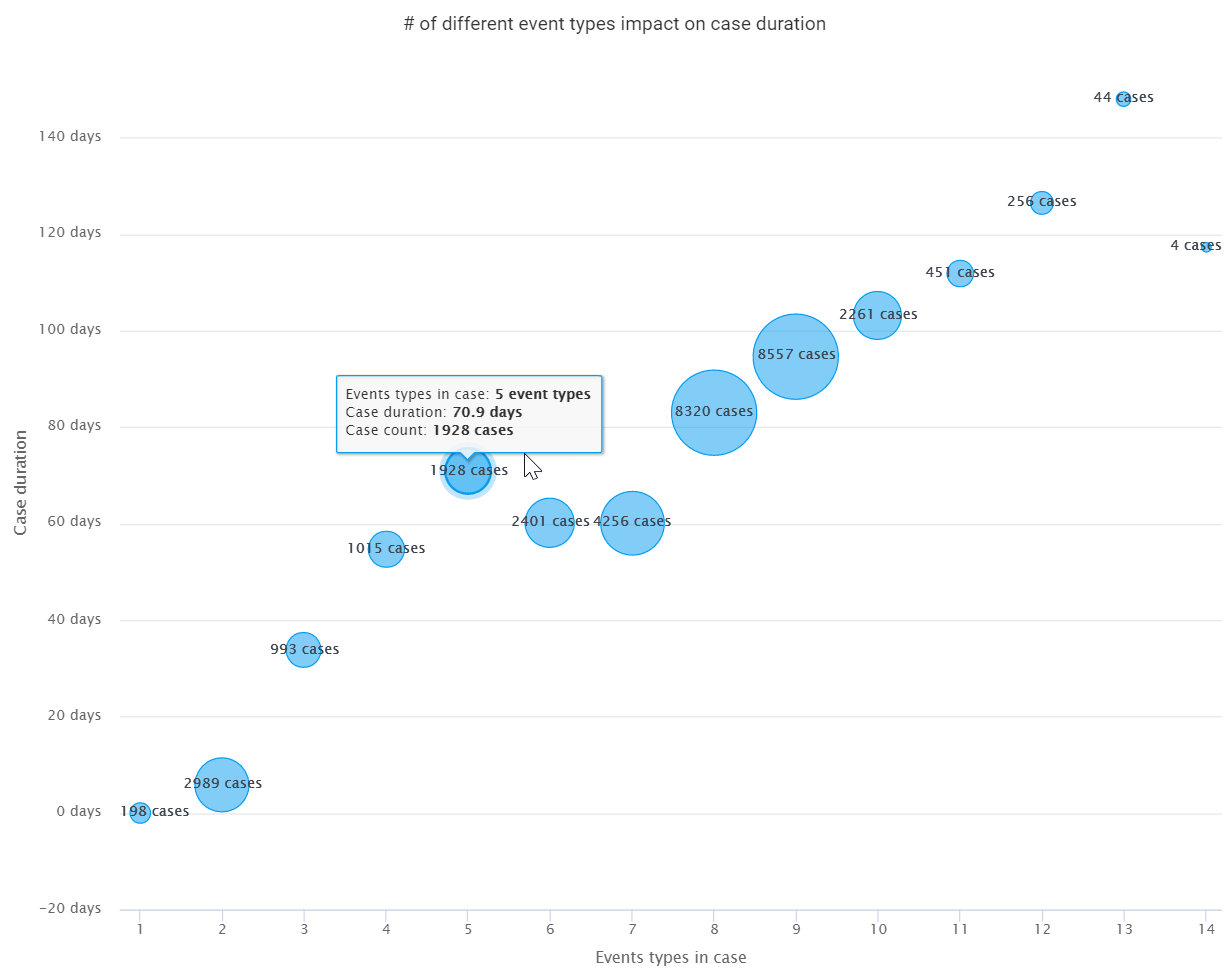
Complex cases have many events causing long lead times.
One objective of your digital transformation initiatives may be to simplify your business. This chart can be used to build a business case for simplification - cases with a small number of distinct event types are likely to complete much faster than cases with many event types causing unnecessary complexity.
Navigation Links ➡️ easy to combine individual dashboard views into full featured process mining applications.
User Selections and filters in one dashboard ➡️ shared with other dashboards for easy drill-down and further analysis options. (URL links to dashboards can be shared in emails, messages, intranet sites and discussion forums.)
Support for array operators and direct access to raw event data ➡️ easier and faster event level KPIs.
This is the new QPR ProcessAnalyzer 2020.4 😀👍
If you’re already using QPR ProcessAnalyzer, go ahead and try these new features when you get a chance. If not, and if you’re new to Process Mining, read more on this page. If you want to know more about QPR ProcessAnalyzer, go here. Also, don’t hesitate to book a live QPR ProcessAnalyzer demo:
It’s a good time to take a look at Process Mining if your company hasn’t already. The capabilities and usability of Process Mining software are improving rapidly, and the market is quickly becoming mature, though there’s still much work to be done. If you think your company is ready to step it up with the future of as-is process modeling and process efficiency maximization, the fastest way to get things moving is to send our Process Mining team a direct message:

QPR ProcessAnalyzer 2020.4 Release Webinar Recording (30 mins)
Download QPR ProcessAnalyzer 2020.4 Release Webinar Presentation Slides here.
Access the See QPR ProcessAnalyzer Release Notes here.

Share Online
Process mining is critical for businesses that want to optimize their operations, reduce costs, and improve customer satisfaction. However, choosing the best...
Are you considering creating a Digital Twin of an Organization to transform your company into a digital organization? Learn the what, why, and how in this blog...
The importance of a company's data strategy in relation to its process mining decisions cannot be overstated.
In today's challenging business landscape, efficiency is the key to staying competitive. At QPR, we're constantly evolving to meet the dynamic needs of our...
Featured Blog
Identifying inefficiencies, risks, and automation opportunities with process mining
“With QPR ProcessAnalyzer, we were able to analyze the process in 2-3 hours instead of three weeks“
Read more