
How to choose the right process mining vendor for your business
Process mining is critical for businesses that want to optimize their operations, reduce costs, and improve customer satisfaction. However, choosing the best...


Are you ready for enhanced BPMN and case-level predictions? QPR 2019.5 introduces the following improvements:
Enhanced BPMN is the latest QPR ProcessAnalyzer feature for combining Business Process Management (BPM) and Business Intelligence (BI). With this tool, you can do advanced process KPI visualizations and analyses:
Custom visualizations with KPI data. Fixed customizable diagrams provide the layout and process mining algorithms provide the KPI data. The custom visualizations with KPI data makes benchmarking and communication easy since the layout stays the same and can be annotated with comments.
Enhanced BPMN diagrams. Many process experts are familiar with BPMN diagrams and now they can get the latest KPI values showing on their familiar BPMN diagrams.
Analyzing parallel lead times and other complex process models is easy by using the familiar BPMN gateways.
Let me show a few examples of using the tool in practice. :) As a starting point, we use the Order-to-Cash model together with Order-to-Cash BPMN diagram:
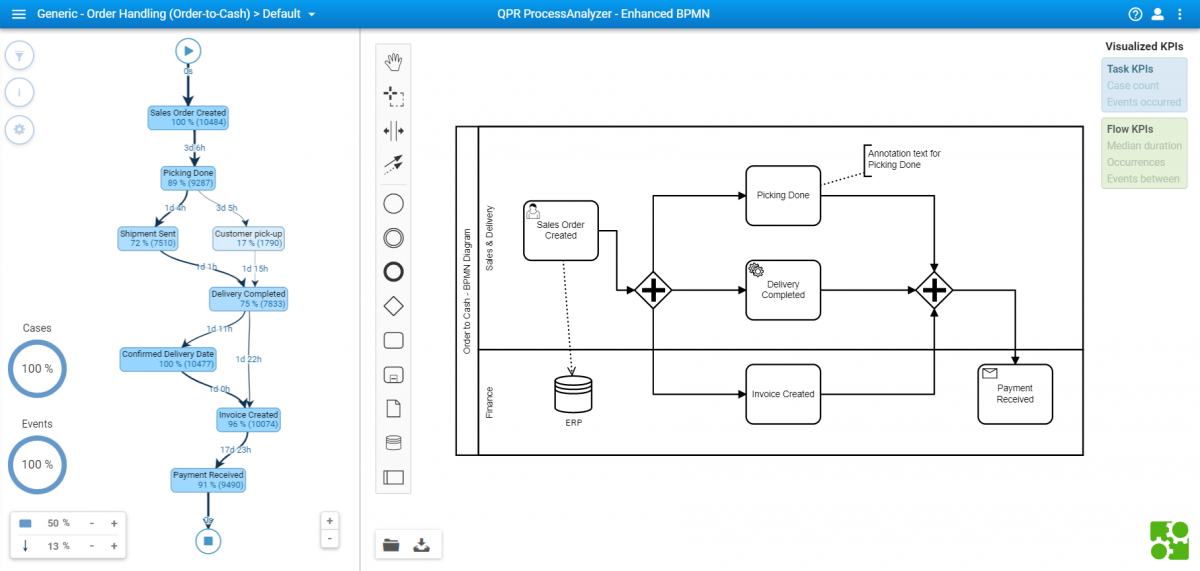

The picture above shows the QPR ProcessAnalyzer with BPMN diagram created with QPR ProcessAnalyzer integrated BPMN editor.
Now let's add the durations:
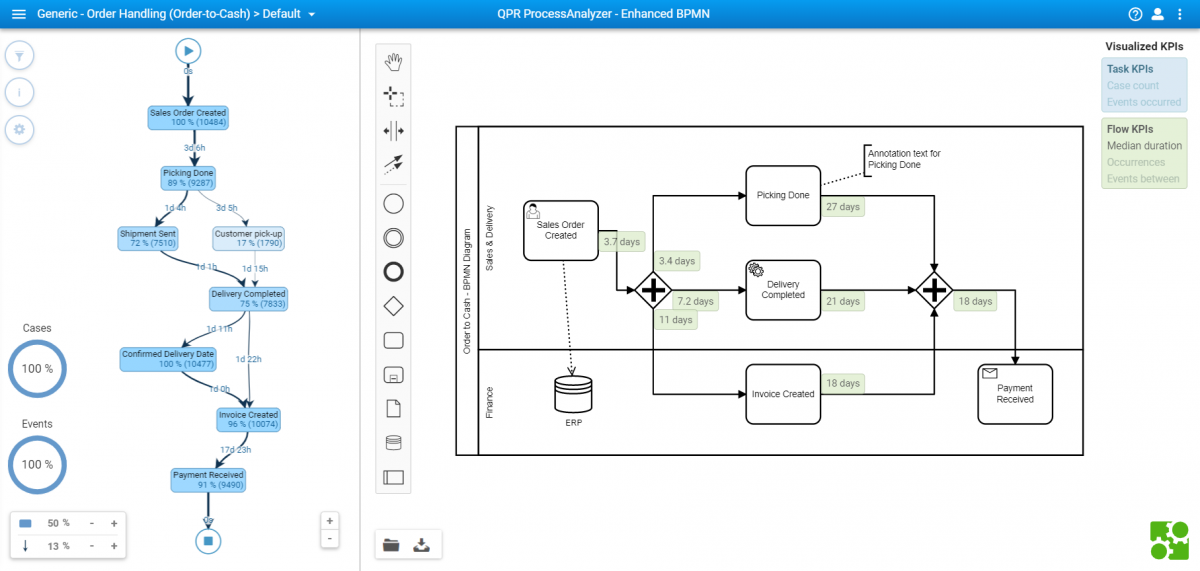
Above we see the fixed layout custom BPMN diagram enhanced with process mining lead-time information. The diagram also highlights parallel behavior and analysis in the underlining data:
Lead-time from Sales Order Created to the first occurrence of either Picking Done, Delivery Completed or Invoice Created is 3.7 days.
With the same logic, we see the lead times from these 3 activities to the actual payment received. This now combines benefits from both using the fixed layout of BPMN with dynamic KPI information for lead times. As you see from the right-hand options we can further visualize for example the Case Count KPIs:
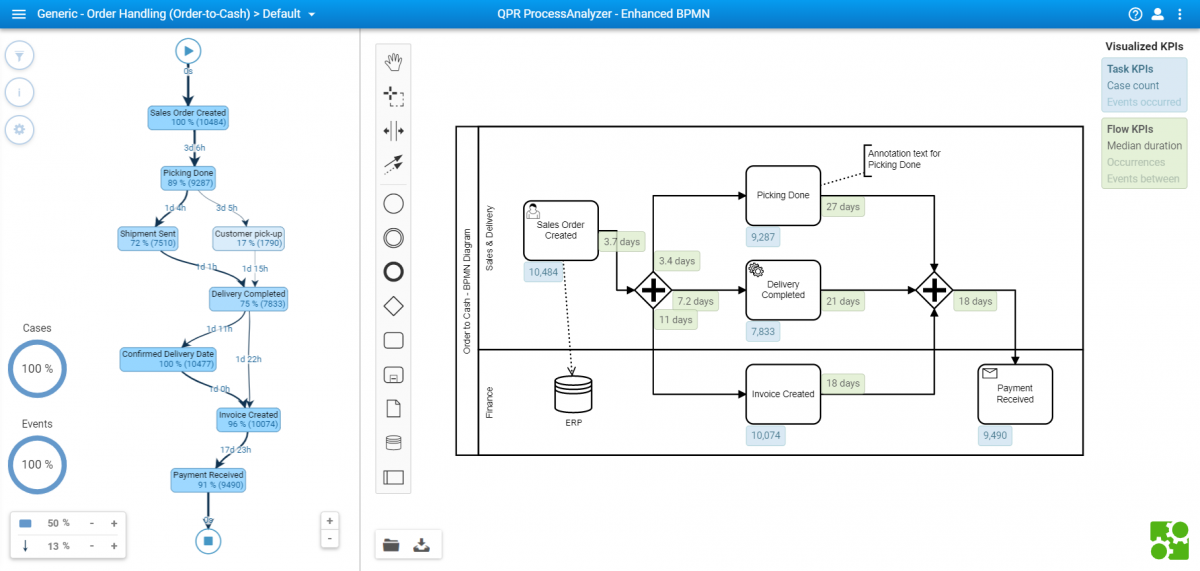
The picture above shows Case Count KPIs added to the BPMN diagram. Import your existing BPMN diagrams or use the built-in BPMN editor to complete your first enhanced BPMN analysis already today!
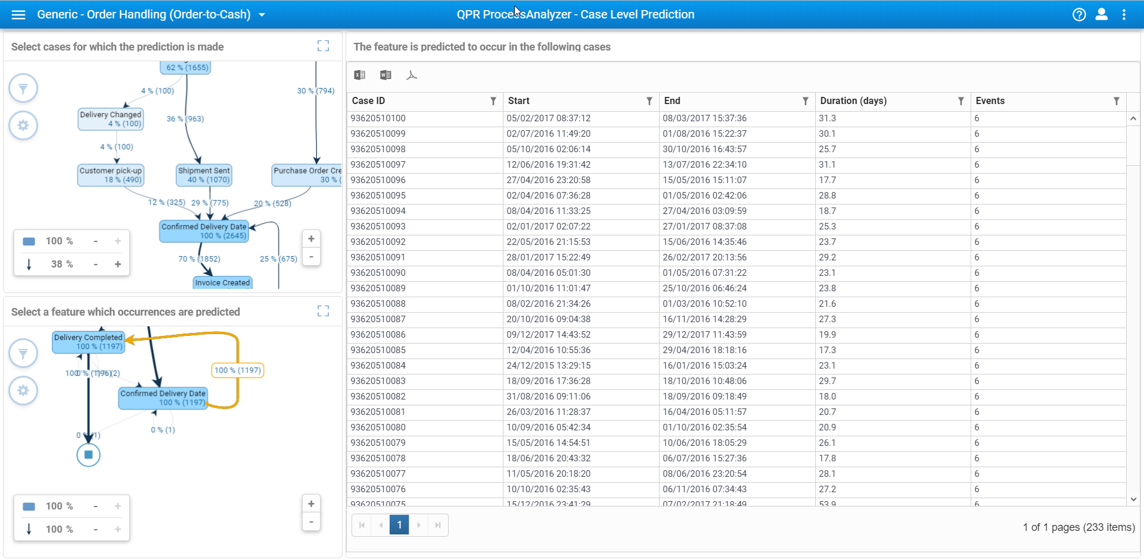
QPR ProcessAnalyzer 2019.5 also introduces the machine learning based case-level predictions! With this new introduction, you can
Case-level predictions are based on the integrated super fast in-memory machine learning library. Results are shown using existing QPR ProcessAnalyzer dashboarding and analysis functionality.
How to use the prediction with the existing model?
Step 1: Select the cases to be used as a training set, typically the completed cases.
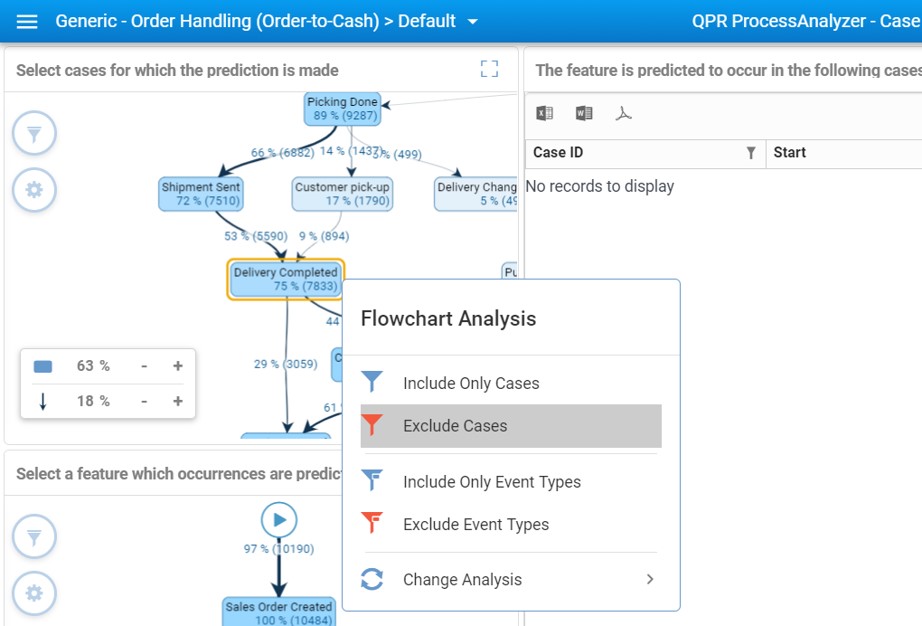
Step 2: Select the case of which you want to create a prediction, typically the on-going cases.
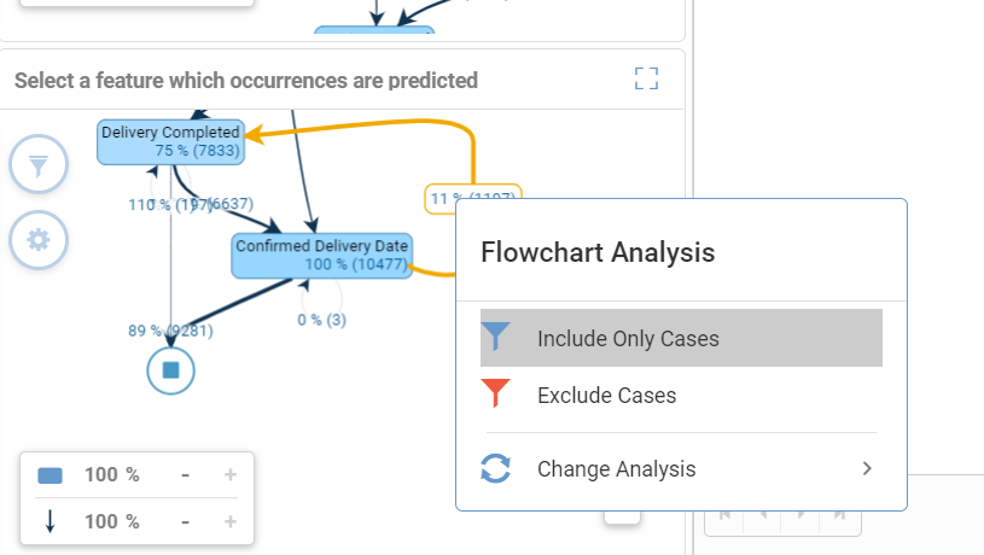
Step 3: Highlight any problem or feature in the training set. QPR ProcessAnalyzer immediately shows the prediction of cases with the same outcome within the on-going cases.
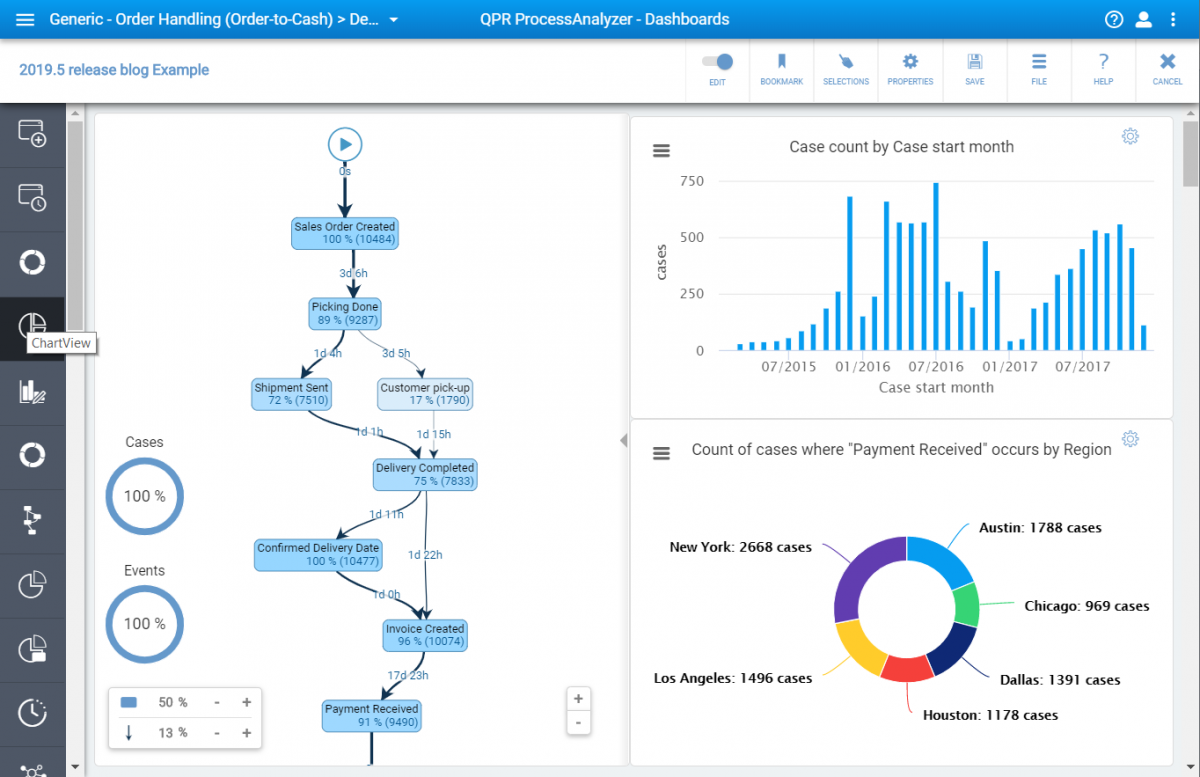
ChartView is a super flexible analysis tool providing graphs, tabular reports, and illustrations based on process mining data. In QPR ProcessAnalyzer 2019.5, ChartView is nicely available as a pre-built component for user dashboards, making it even easier to build and maintain custom dashboards.
Check out the screenshot below showing two ChartView components embedded into a custom dashboard. The tool palette on the left shows the new ChartView icon, which lets you add more ChartView components as you wish - voila!

Share Online

Process mining is critical for businesses that want to optimize their operations, reduce costs, and improve customer satisfaction. However, choosing the best...

Are you considering creating a Digital Twin of an Organization to transform your company into a digital organization? Learn the what, why, and how in this blog...

The importance of a company's data strategy in relation to its process mining decisions cannot be overstated.
In today's challenging business landscape, efficiency is the key to staying competitive. At QPR, we're constantly evolving to meet the dynamic needs of our...
Featured Blog
Identifying inefficiencies, risks, and automation opportunities with process mining
“With QPR ProcessAnalyzer, we were able to analyze the process in 2-3 hours instead of three weeks“
Read more